         onset  duration  value trial_type
25   10.518528      10.0    1.0          A
26  185.696256      10.0    1.0          A
27  232.783872      10.0    1.0          A
28  272.891904      10.0    1.0          A
29  309.067776      10.0    1.0          A
30  346.324992      10.0    1.0          A
31  438.730752      10.0    1.0          A
32  530.546688      10.0    1.0          A
33  737.574912      10.0    1.0          A
34  876.380160      10.0    1.0          A
35   59.670528      10.0    1.0          B
36  108.036096      10.0    1.0          B
37  148.242432      10.0    1.0          B
38  399.310848      10.0    1.0          B
39  577.732608      10.0    1.0          B
40  612.237312      10.0    1.0          B
41  649.691136      10.0    1.0          B
42  687.144960      10.0    1.0          B
43  784.662528      10.0    1.0          B
44 913.440768 10.0 1.0 BfNIRS in Neonatal Research
Experimental design, data analysis and real-data analysis in Python
Institut de Recerca Sant Joan de Déu (IRSJD)
May 15, 2026
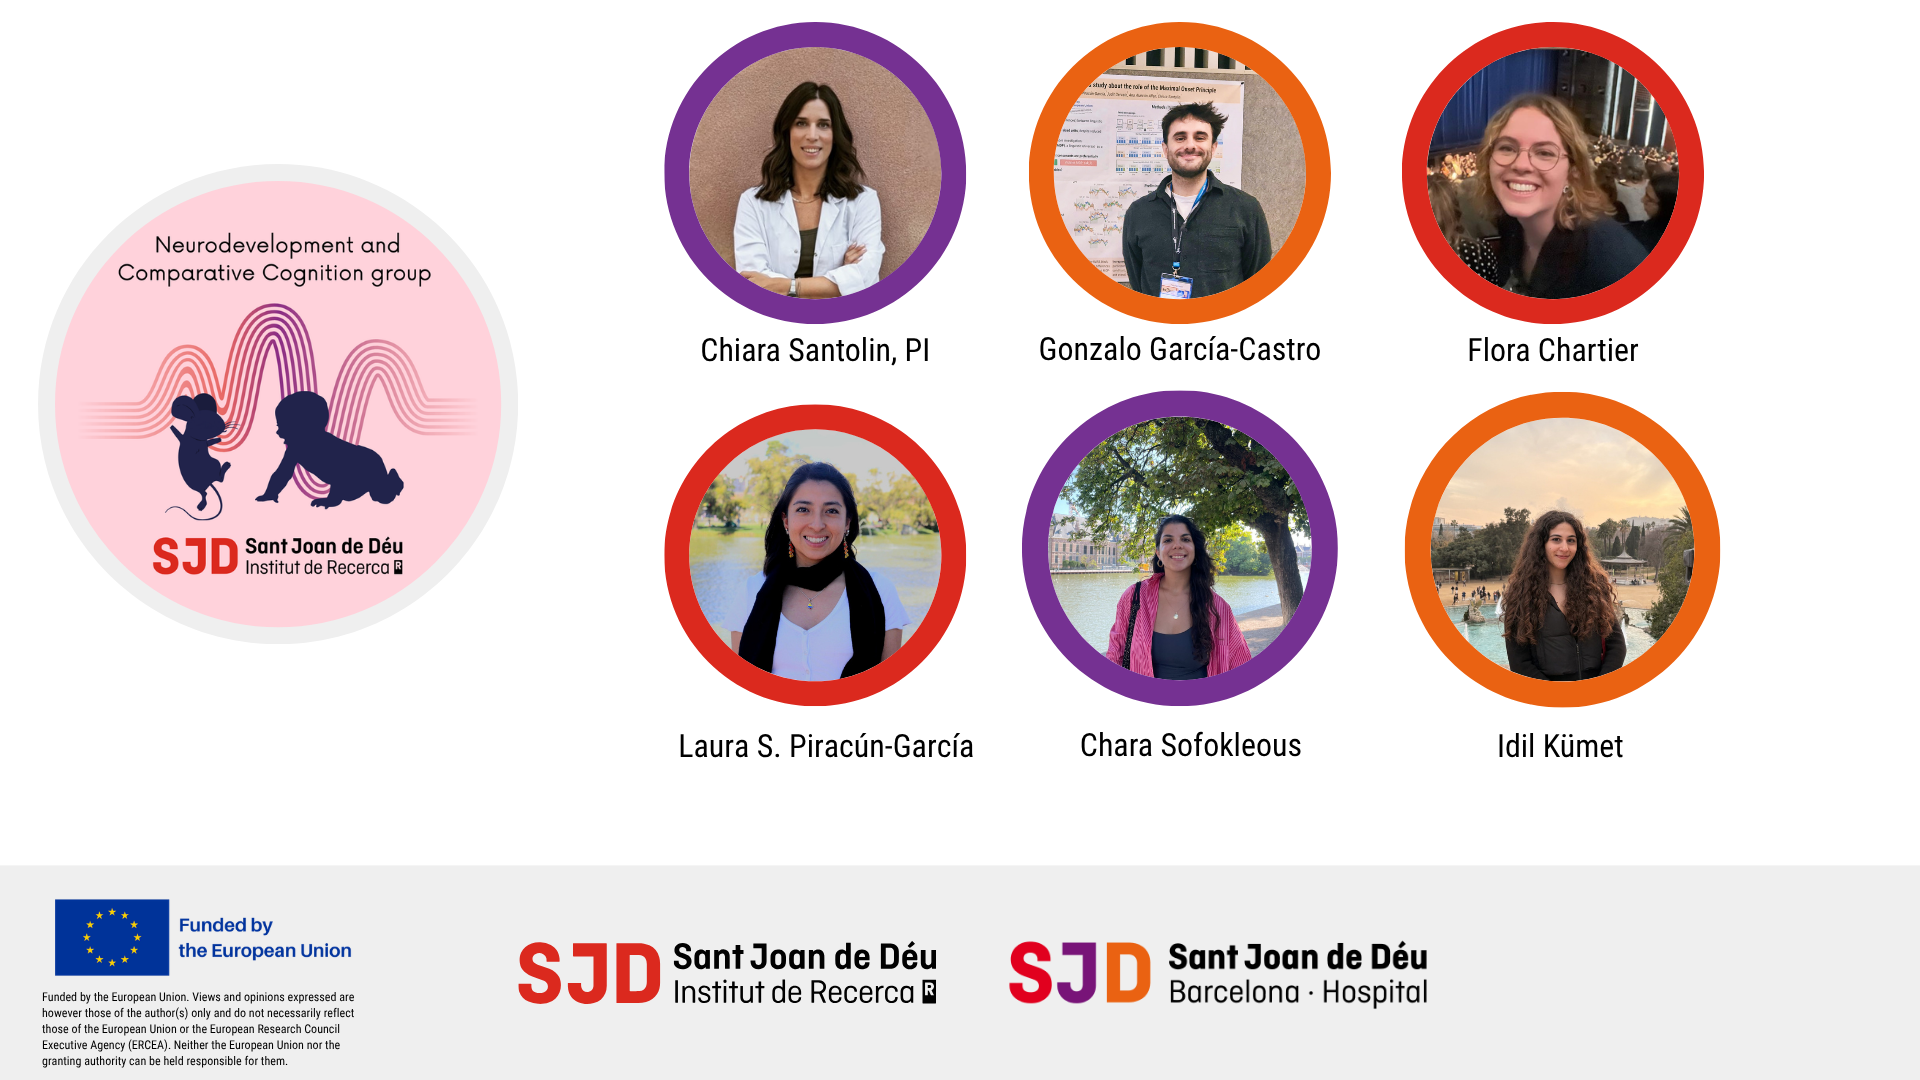
About us
NeuroDevelopment and Comparative Cognition (NeuroDevCo)
HORIZON-ERC-2023-StG: GALA (Gates to Language)
Functional Near-Infrared Spectroscopy
Some materials have different optical properties than others (i.e., absorbe more light at some wavelengths).
We can study the composition of an object by analysing how light behaves when passing through it (i.g., spectroscopy)
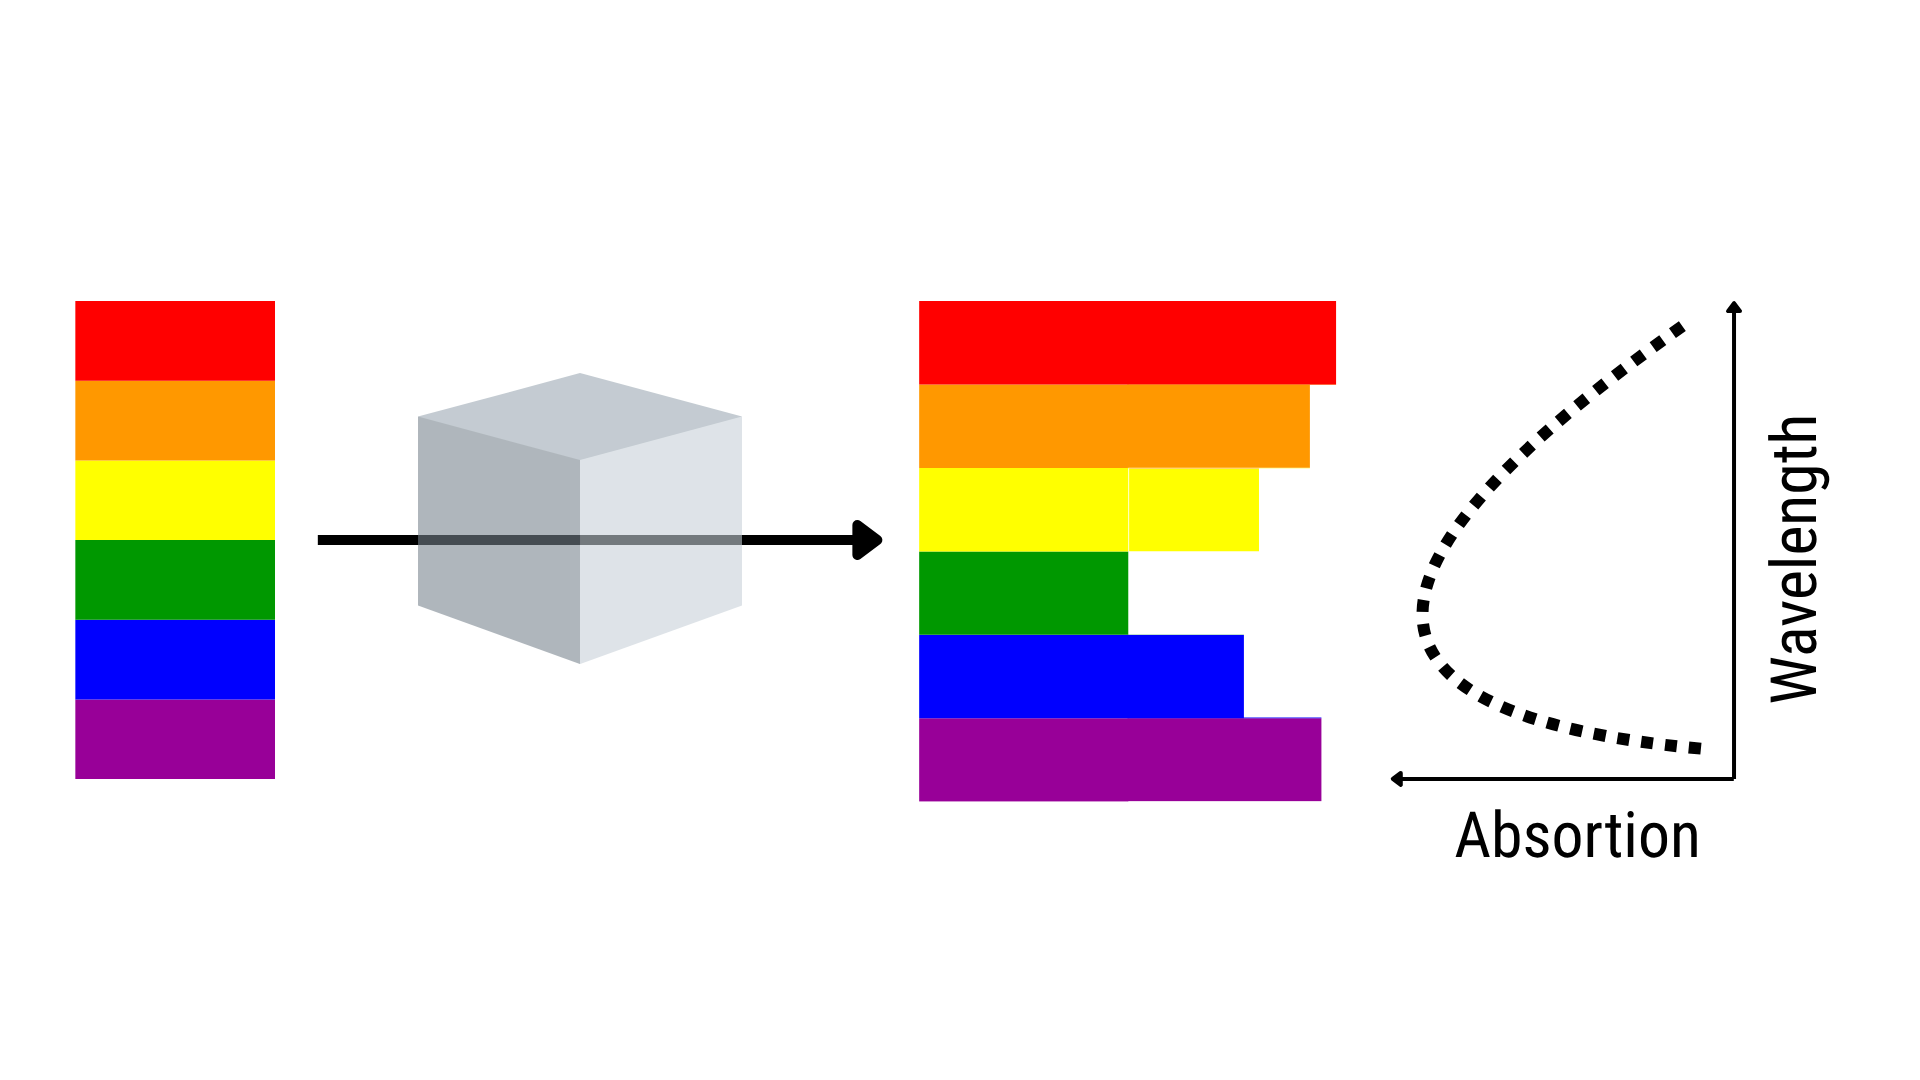
Functional Near-Infrared Spectroscopy
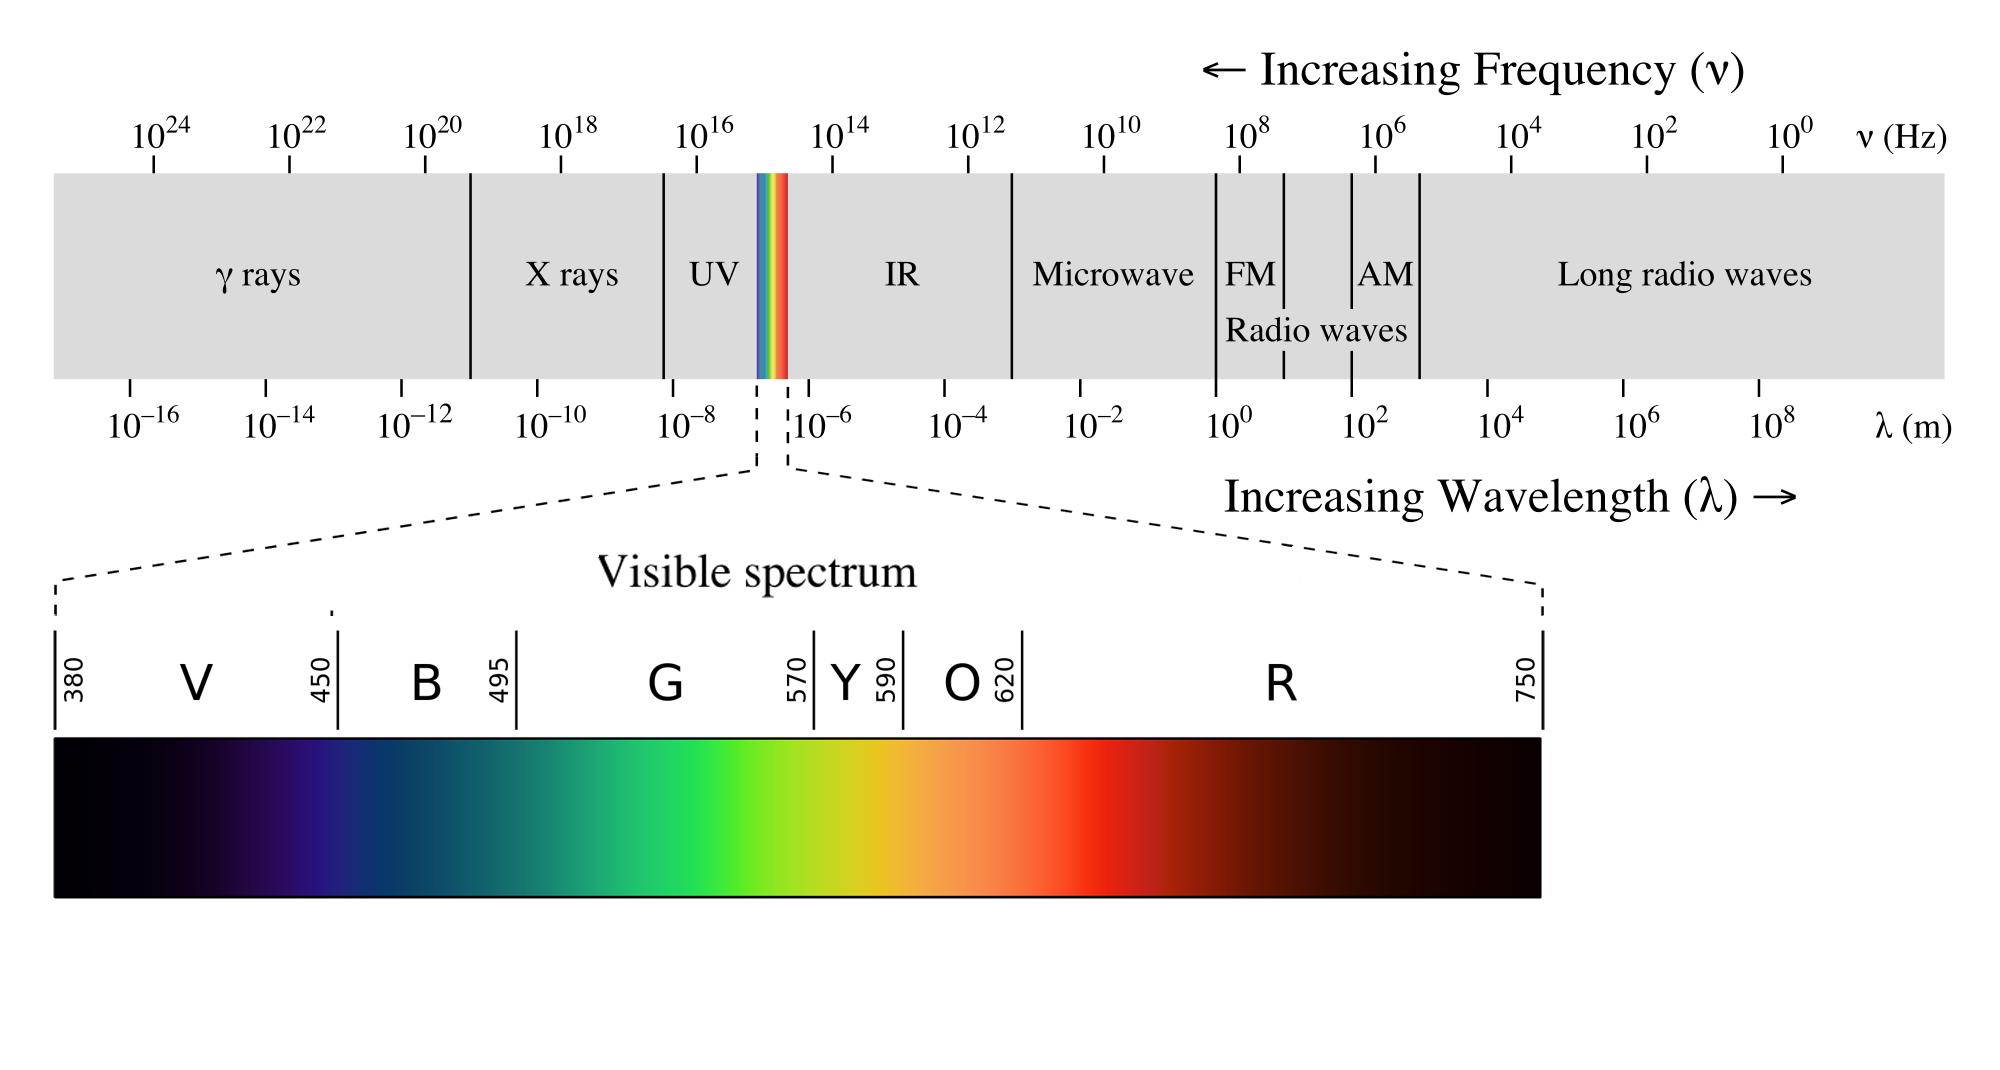
Functional Near-Infrared Spectroscopy
Oxy-haemoglobin (HbO) and deoxy-haemoglobin (HbR) absorb near-infrared light differently
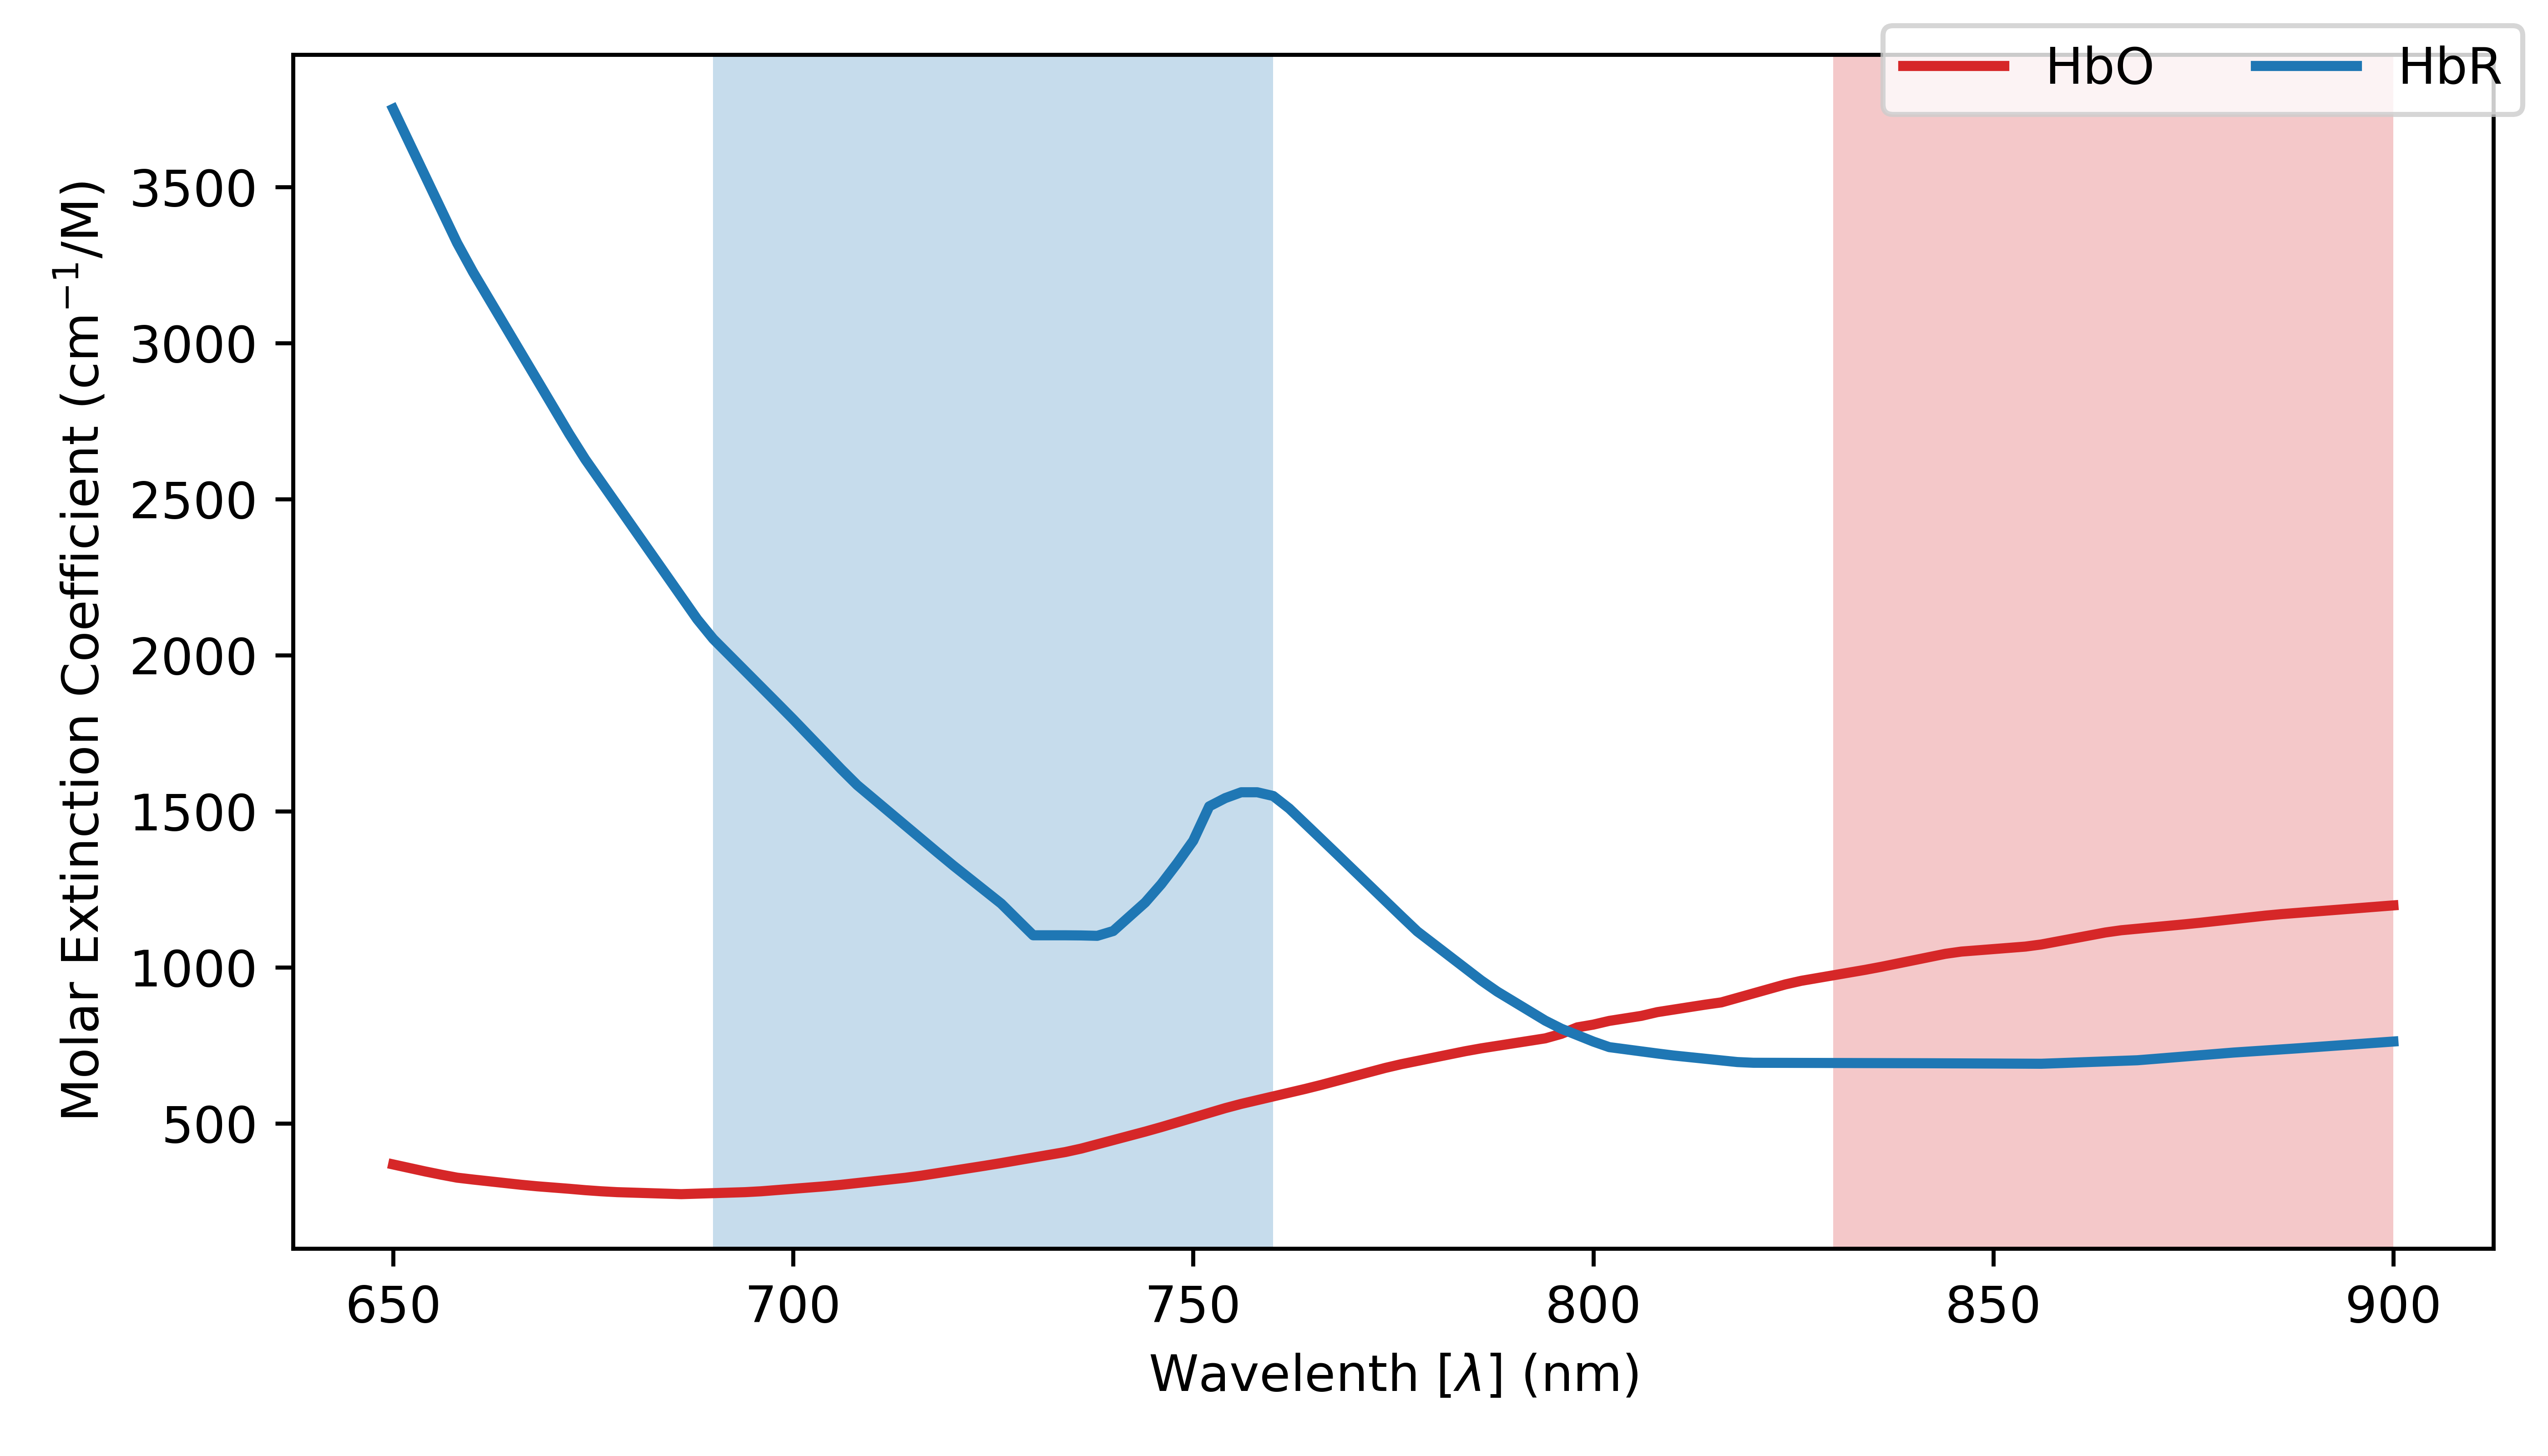
NIR light absorption by Hb
Functional Near-Infrared Spectroscopy
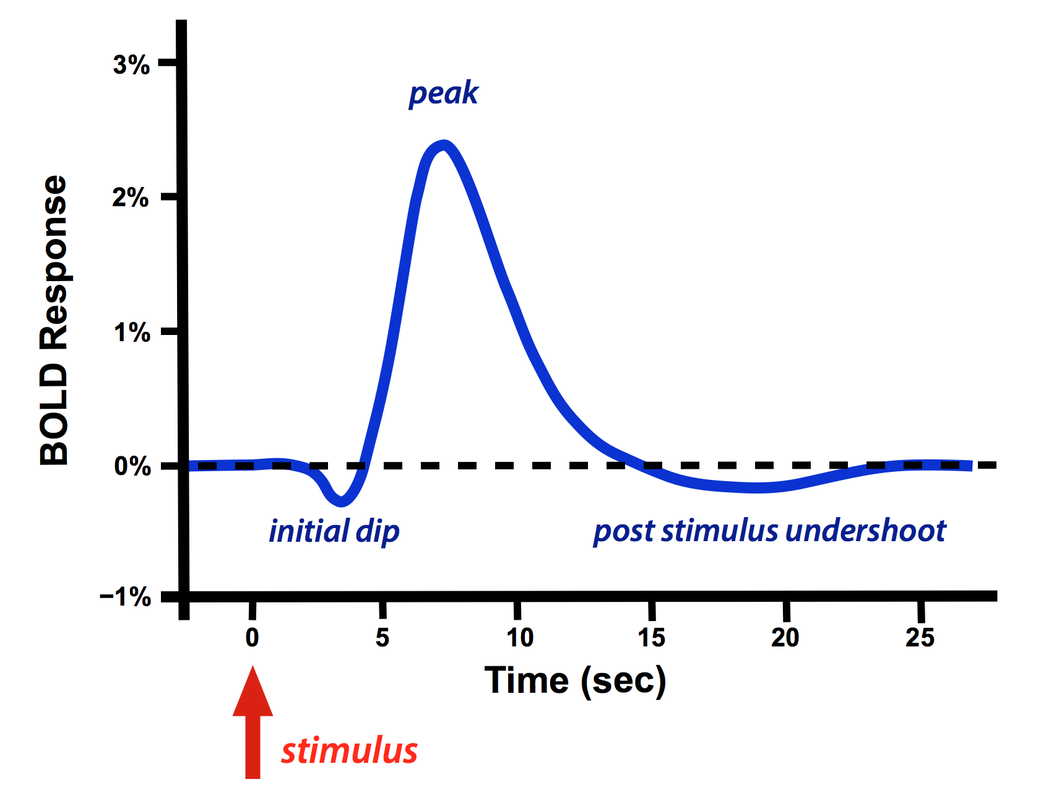
- Blood-Oxygen-Level-Dependent (BOLD) response
- Surplus of HbO sent to recently active brain areas
- Takes ~15 seconds recover baseline
Functional Near-Infrared Spectroscopy
Canonical Haemodynamic Response Function (HRF)
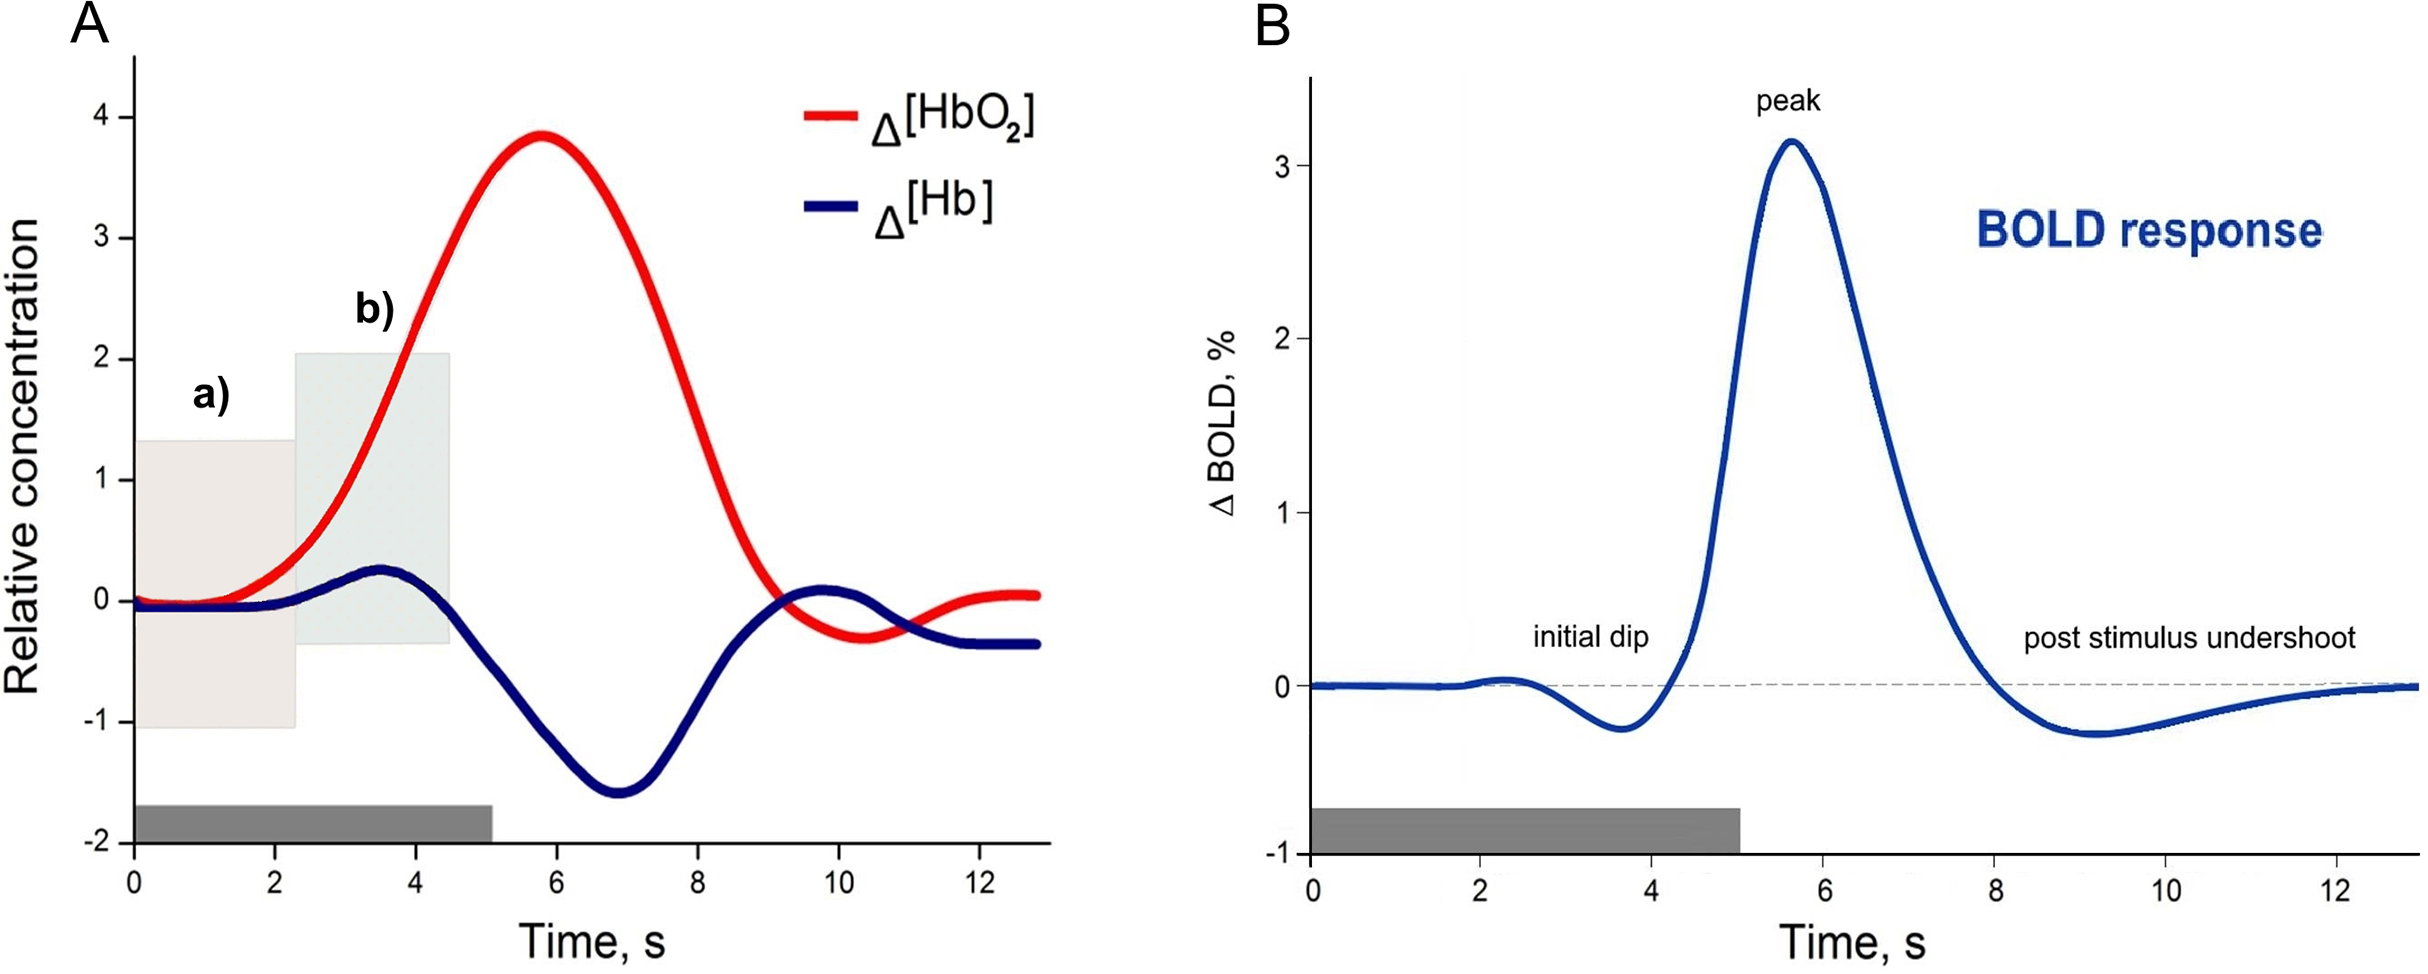
Cinciute (2019)
fNIRS for experimental tasks
Hramov et al. (2020)
Resources
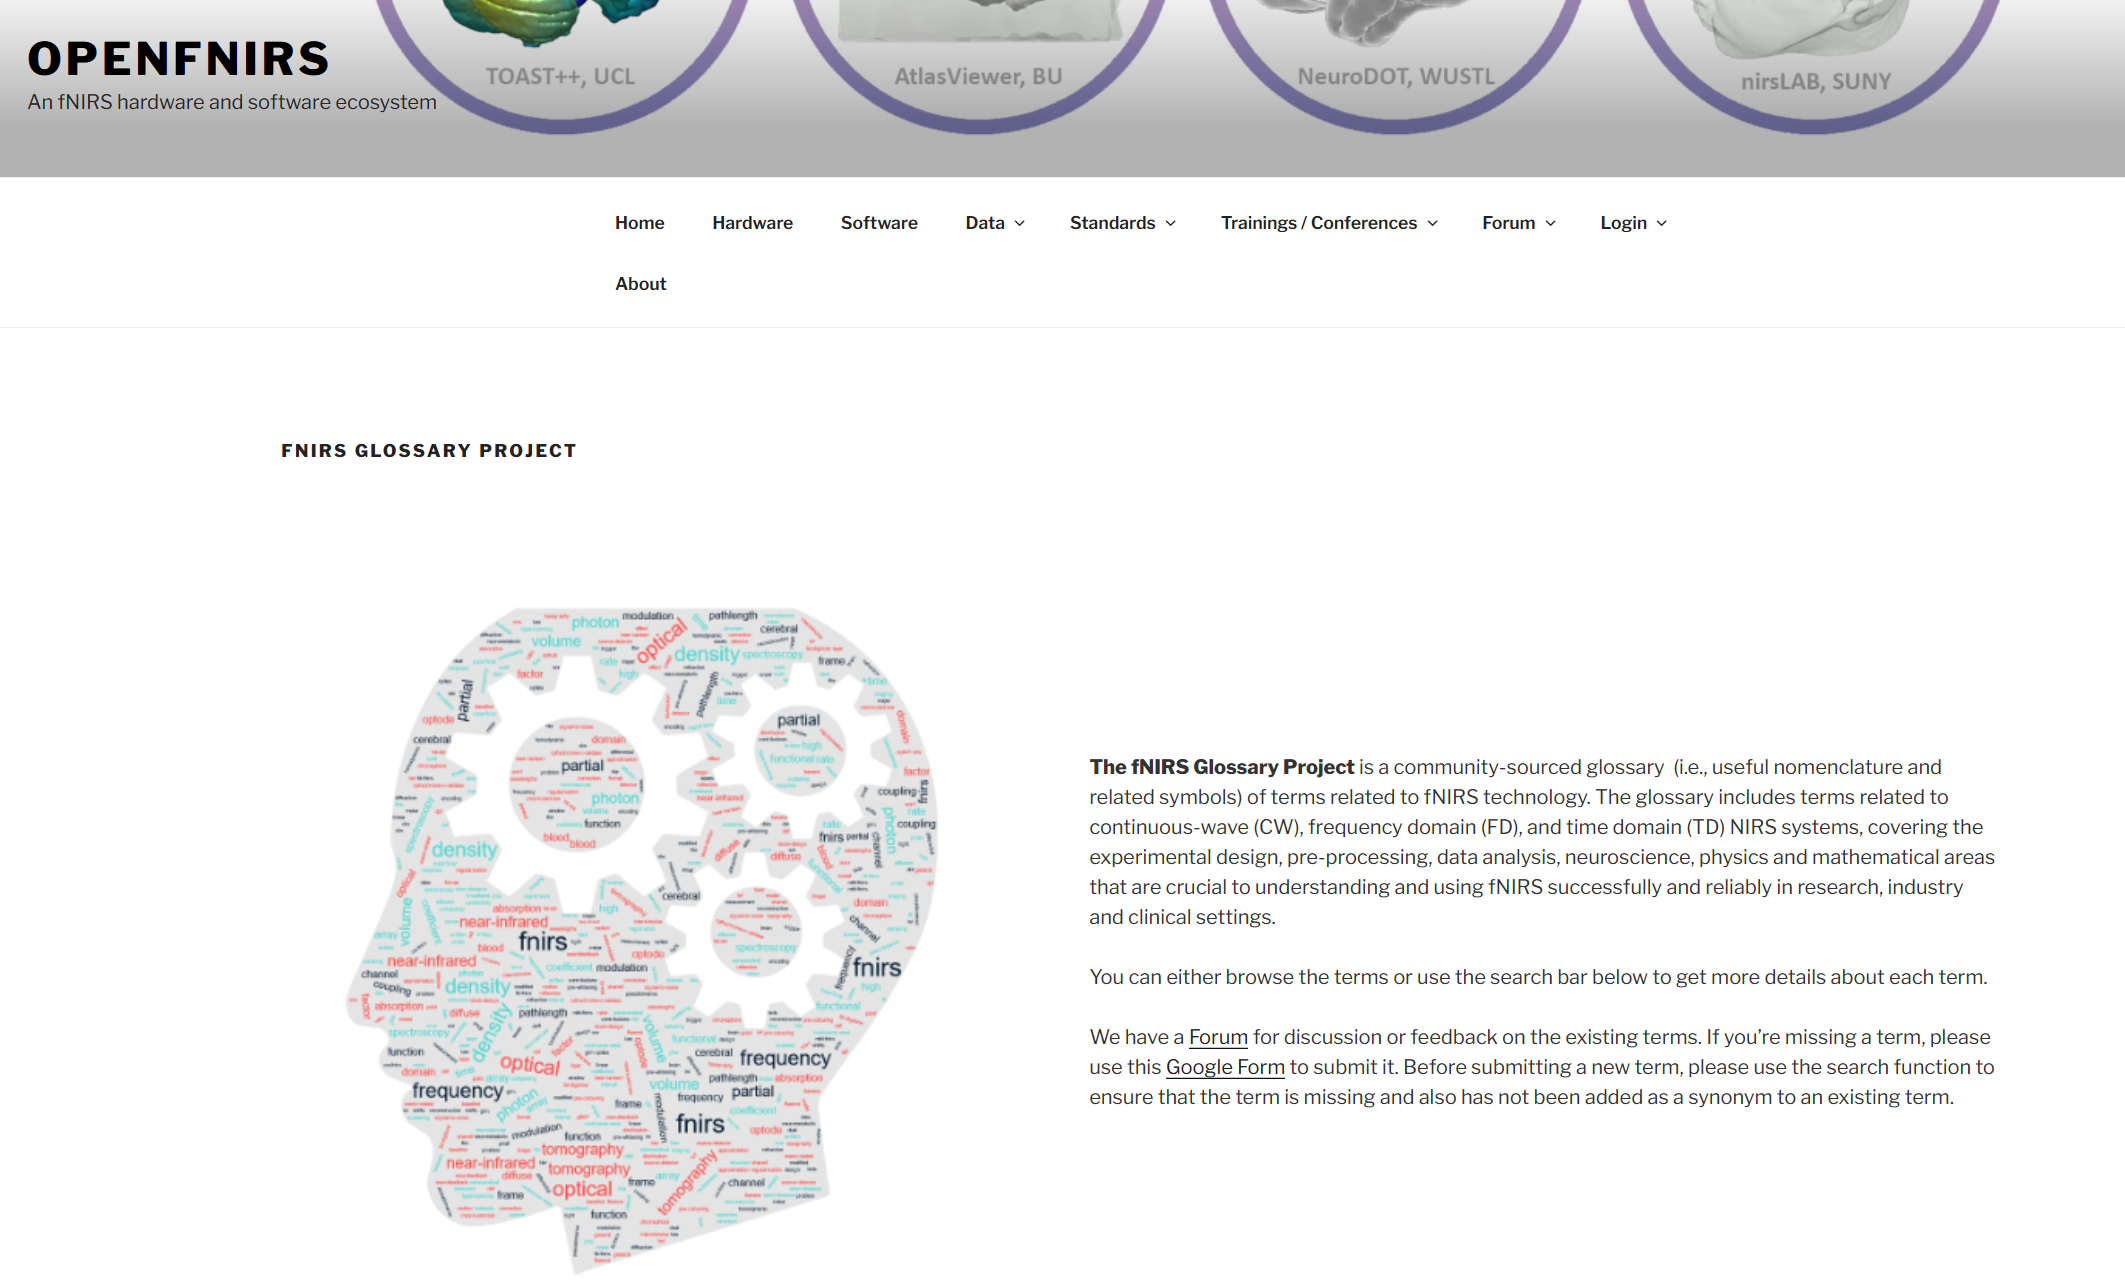
The fNIRS Glossary project (Stute et al. 2025)
https://openfnirs.org/standards/fnirs-glossary-project/
Resources
Society for Functional Near Infrared Spectroscopy (SFNIRS)
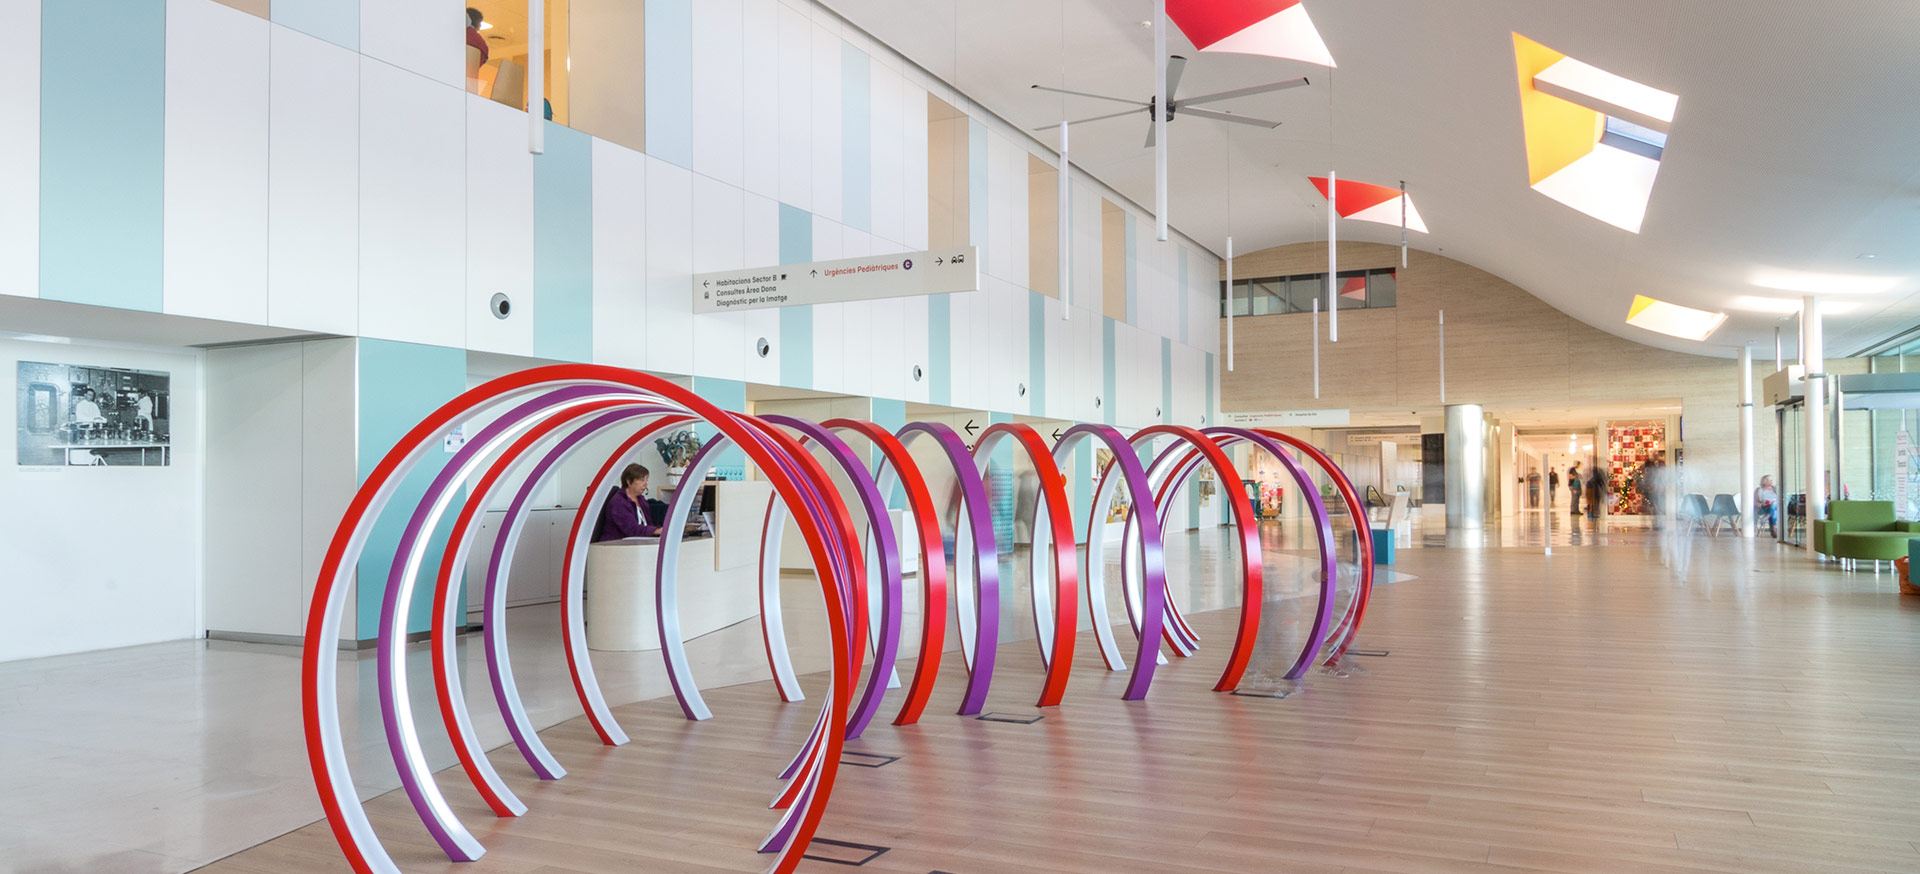
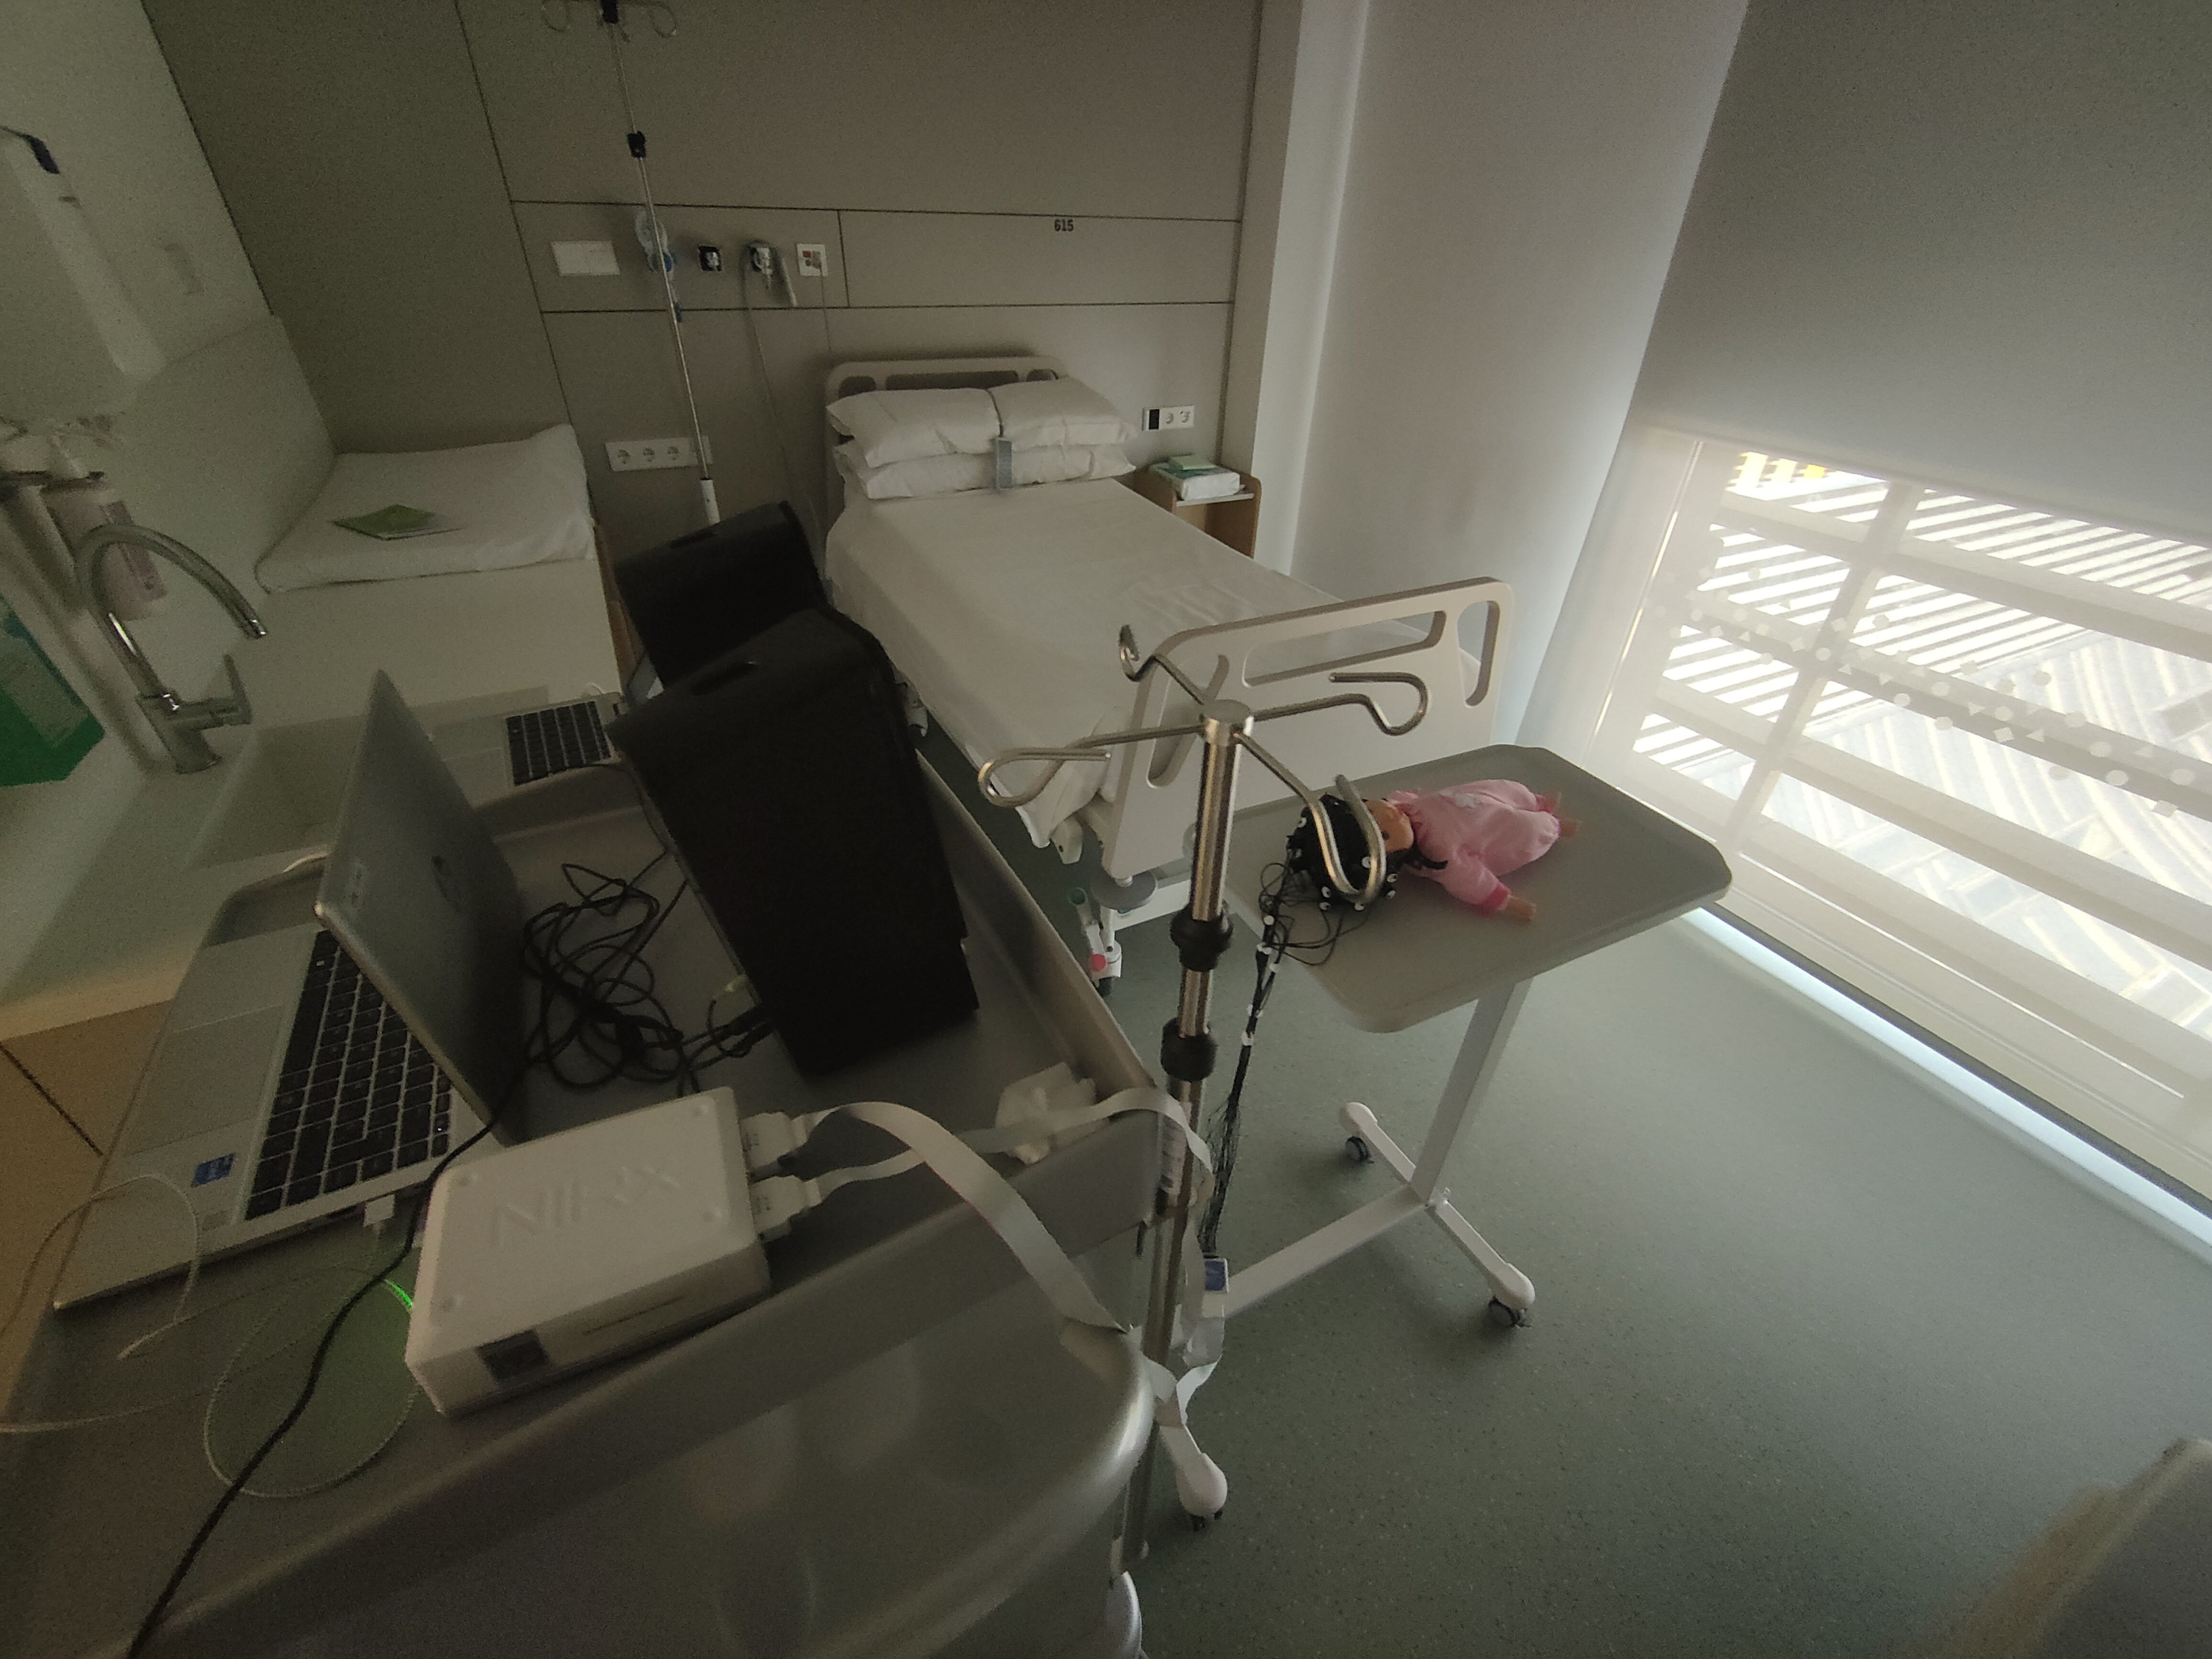
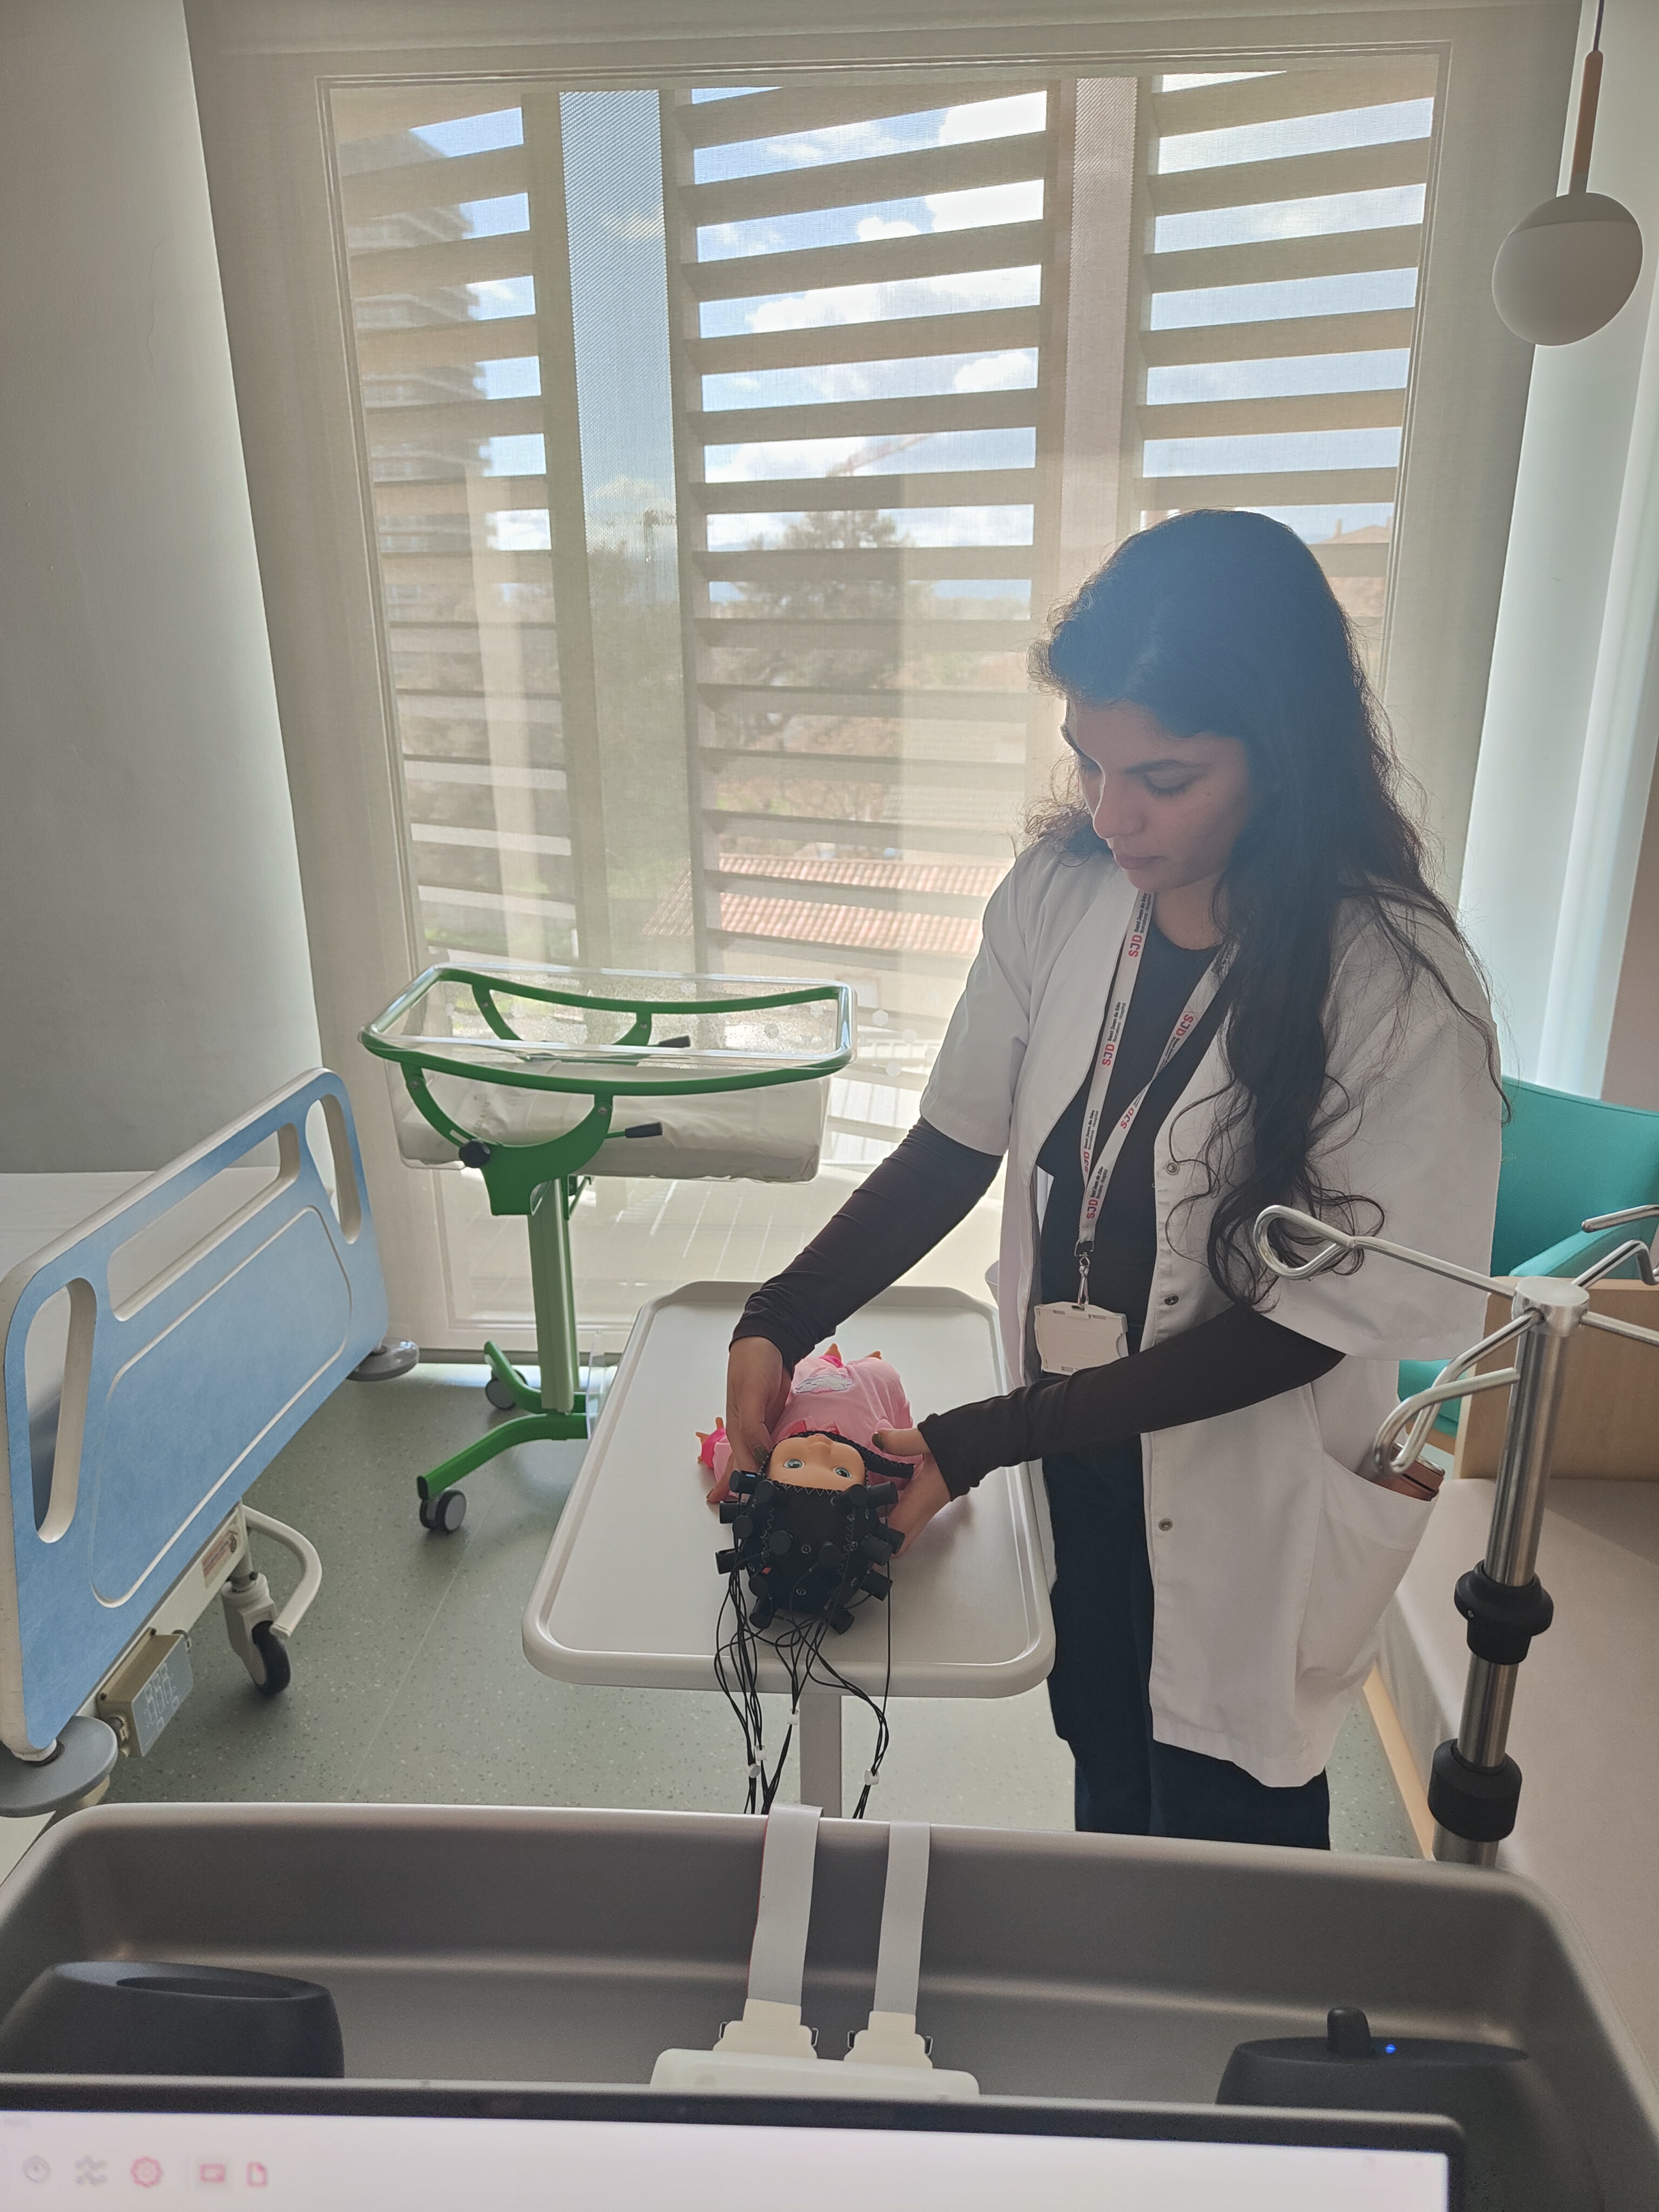
fNIRS at the Hospital Sant Joan de Déu
Healthy participants: ≥ 2,700 g & ≥ 8 Apgar-10 & ≥37 weeks post-mentrual age
Tested 6-72 hours after delivery
Cot-side testing inside hospital room (Àrea de la Dona)
fNIRS at the Hospital Sant Joan de Déu
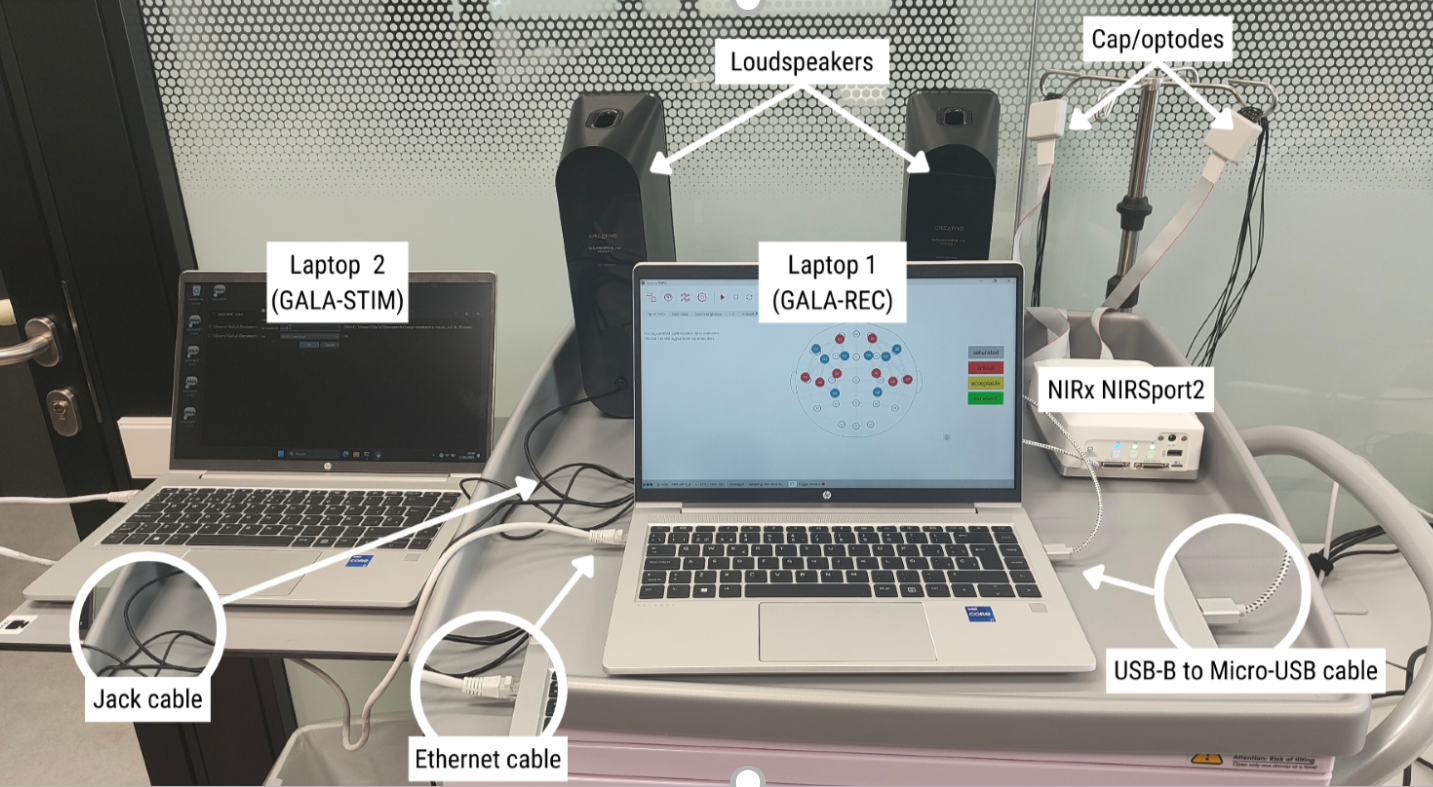
fNIRS at the Hospital Sant Joan de Déu
Setup
fNIRS at the Hospital Sant Joan de Déu
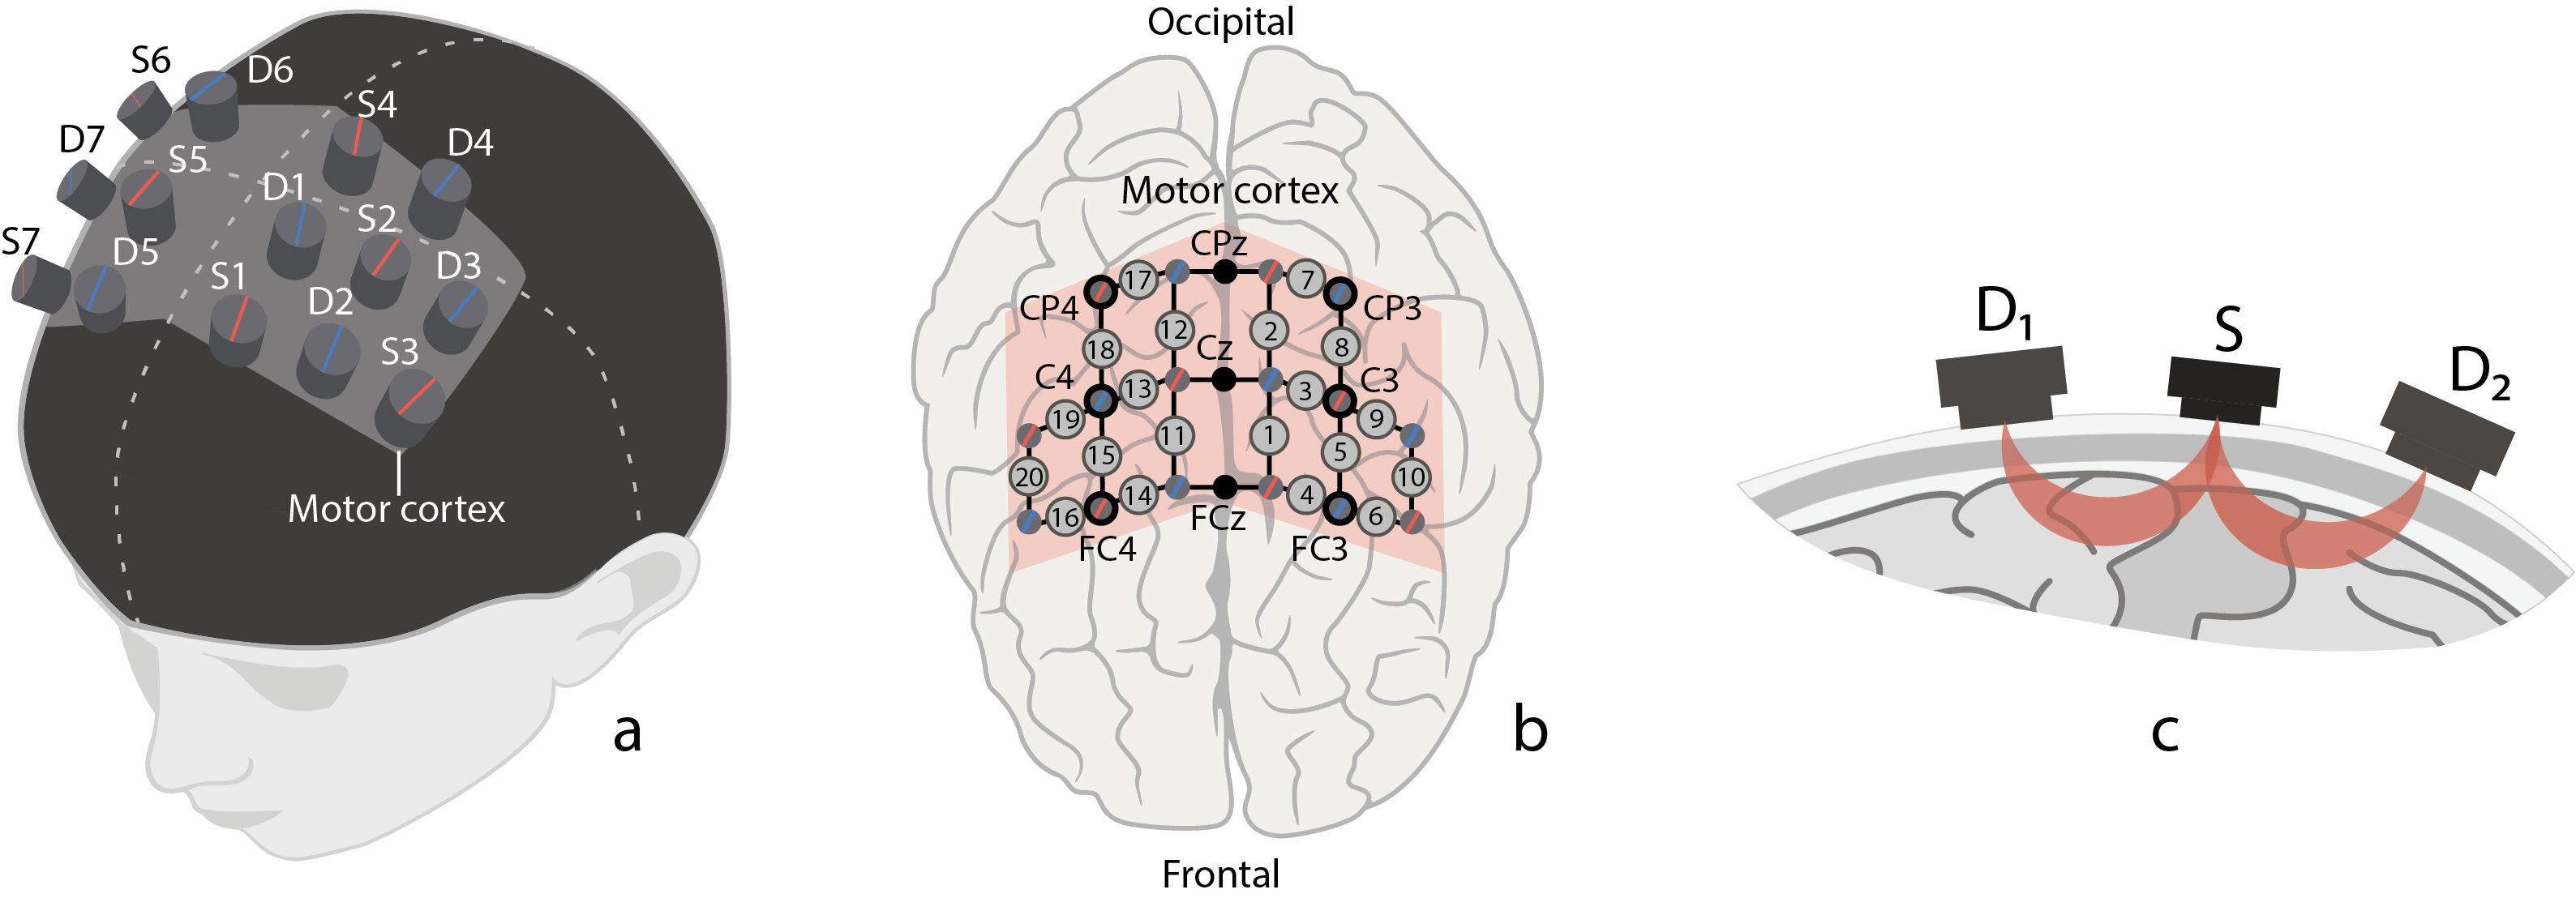
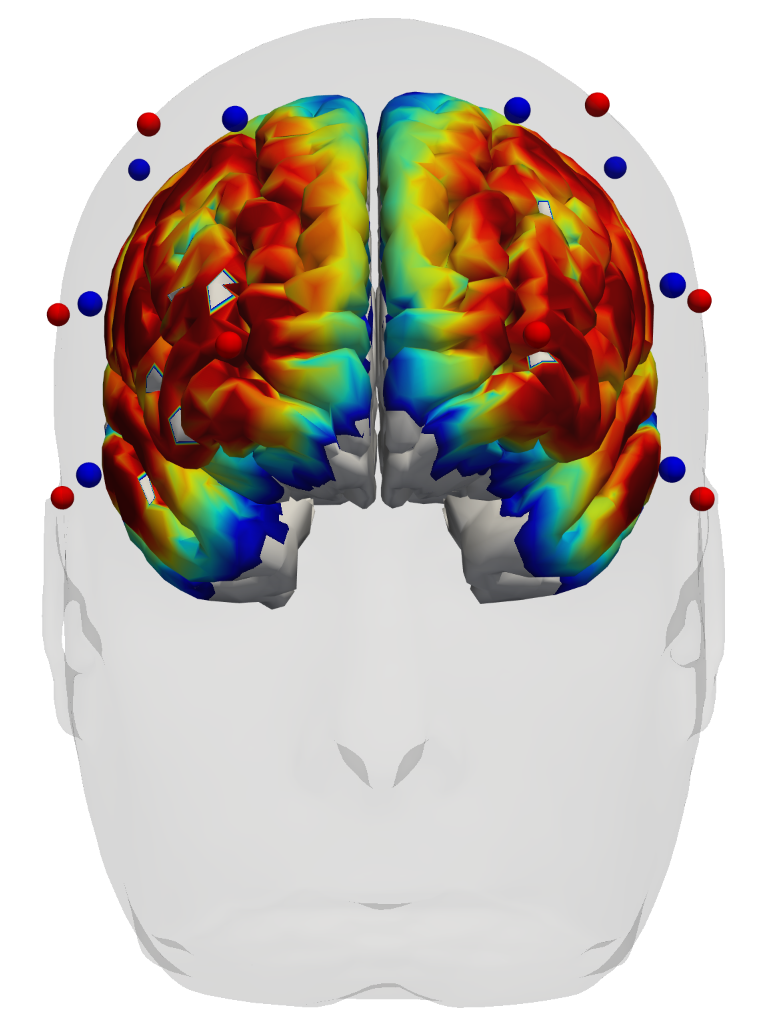
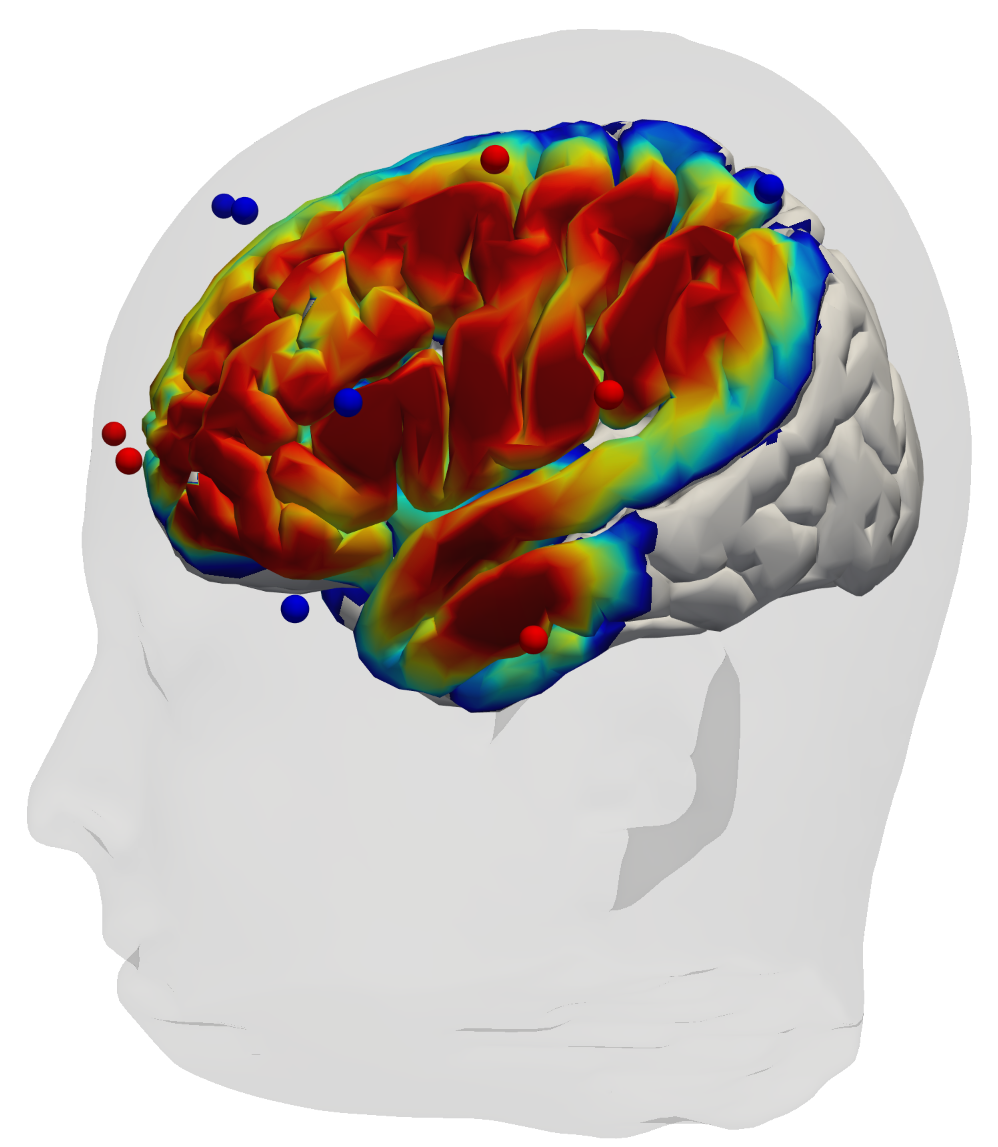
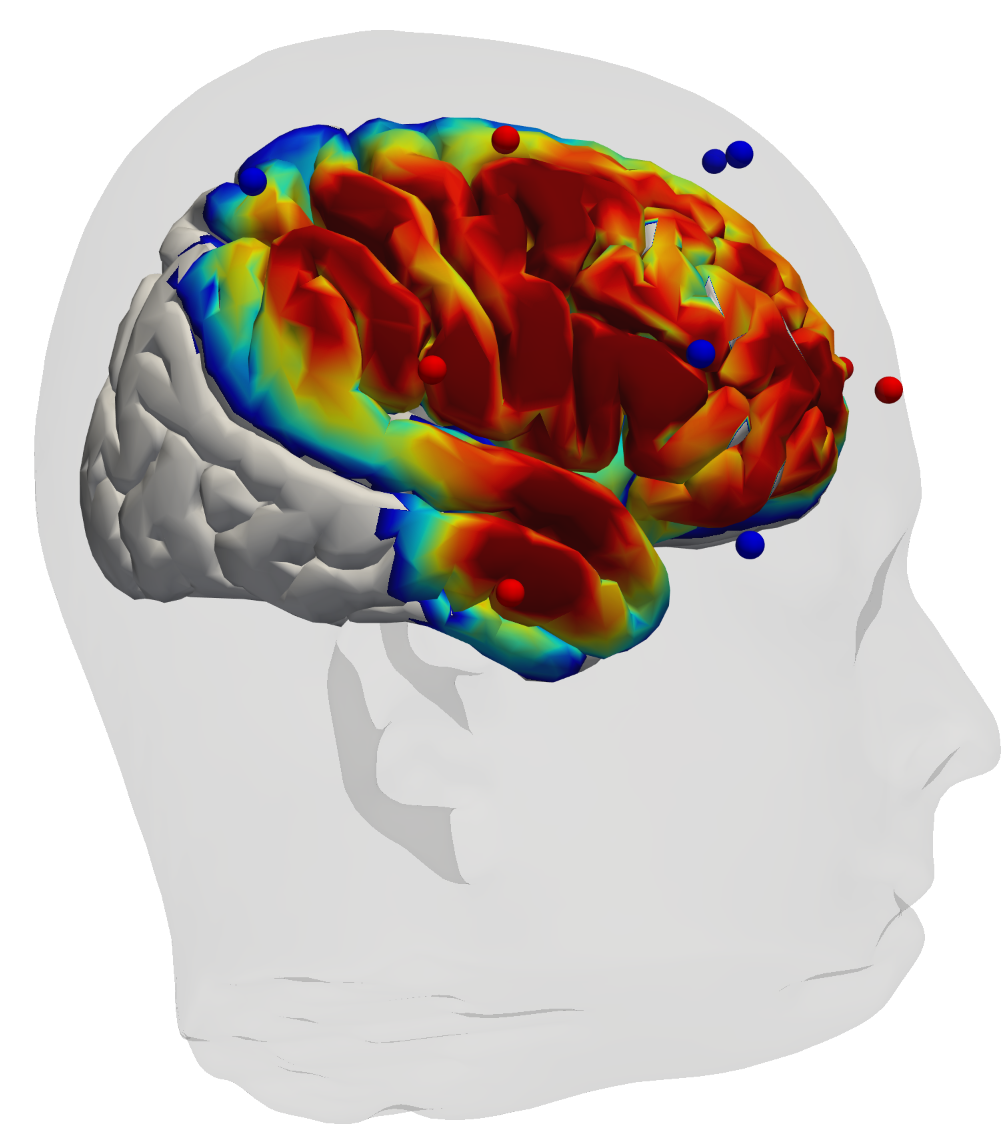
Montage/optode layout
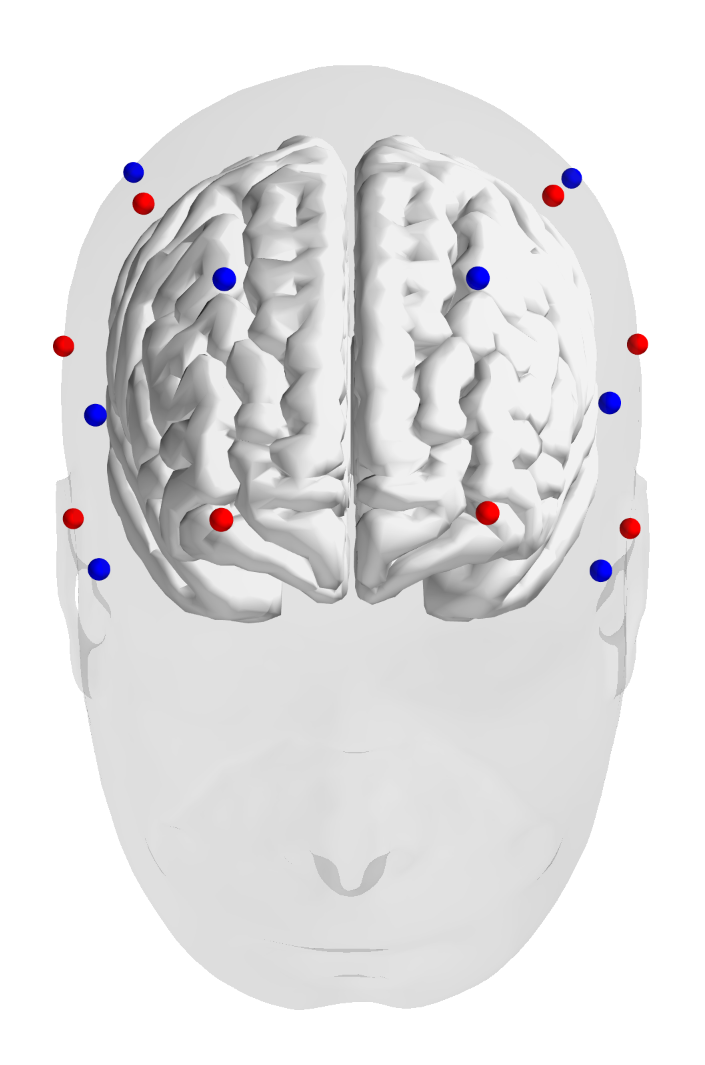
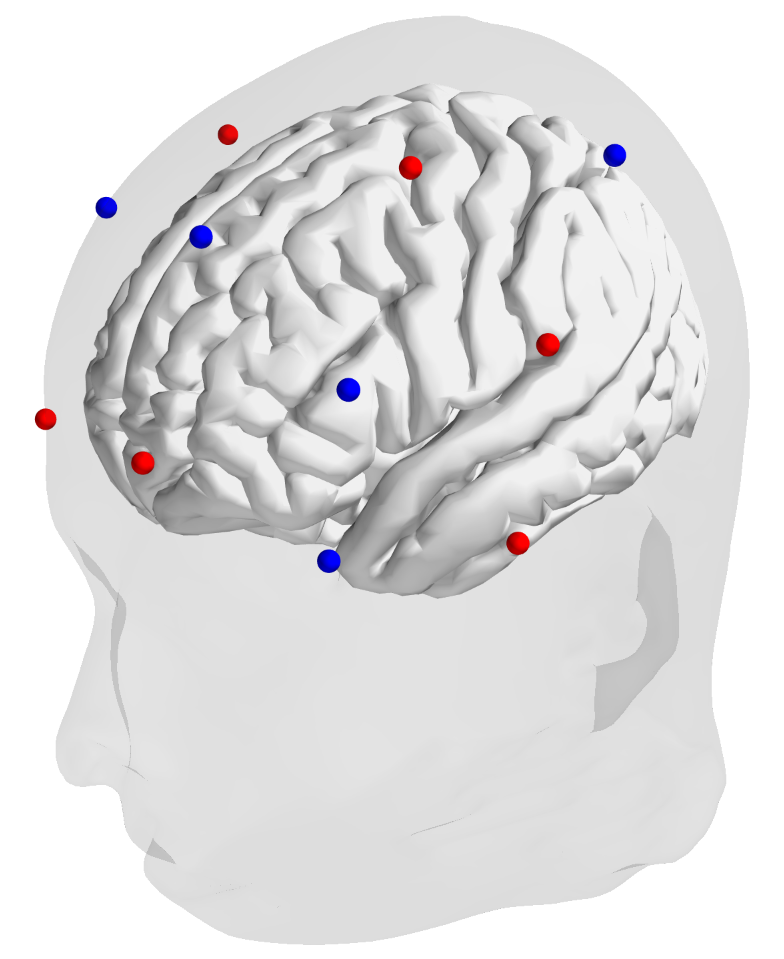
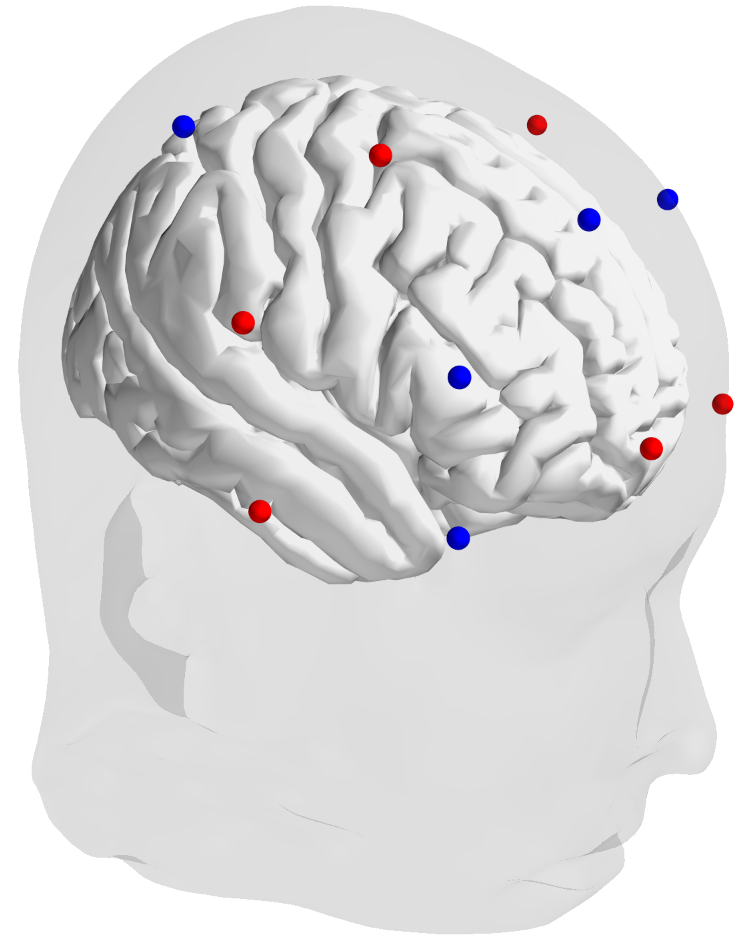
fNIRS at the Hospital Sant Joan de Déu
Montage/optode layout
fNIRS in neonates
Canonical response
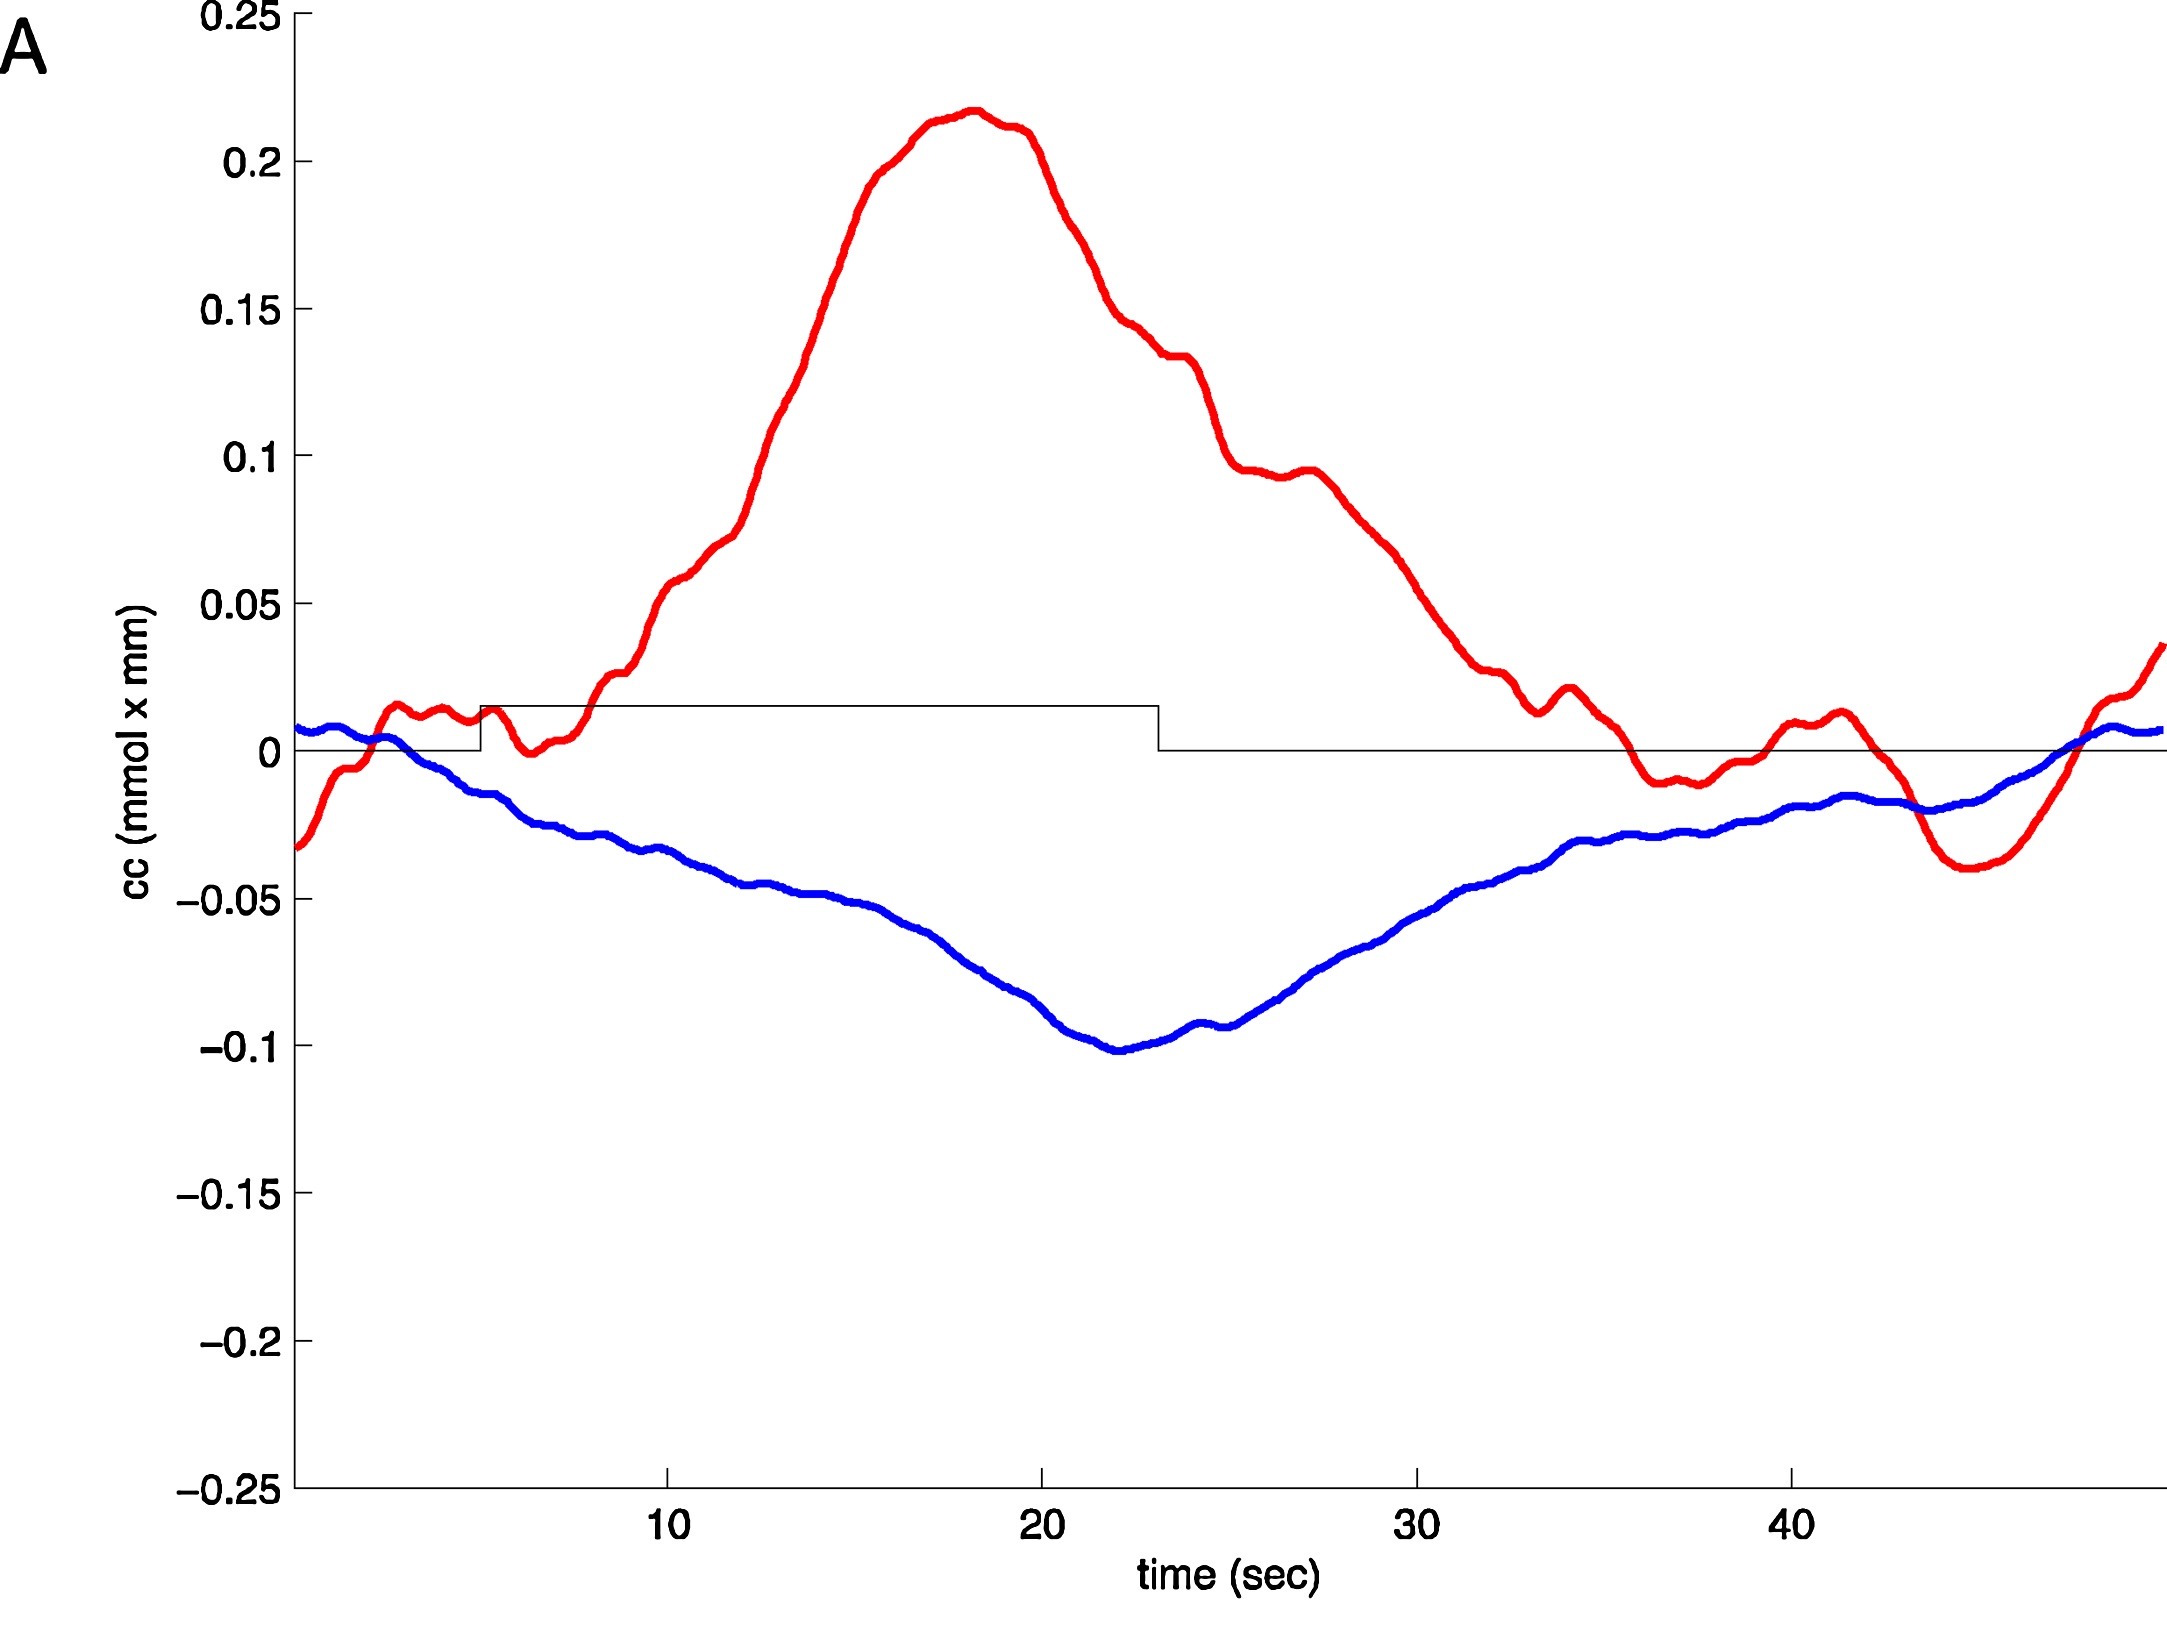
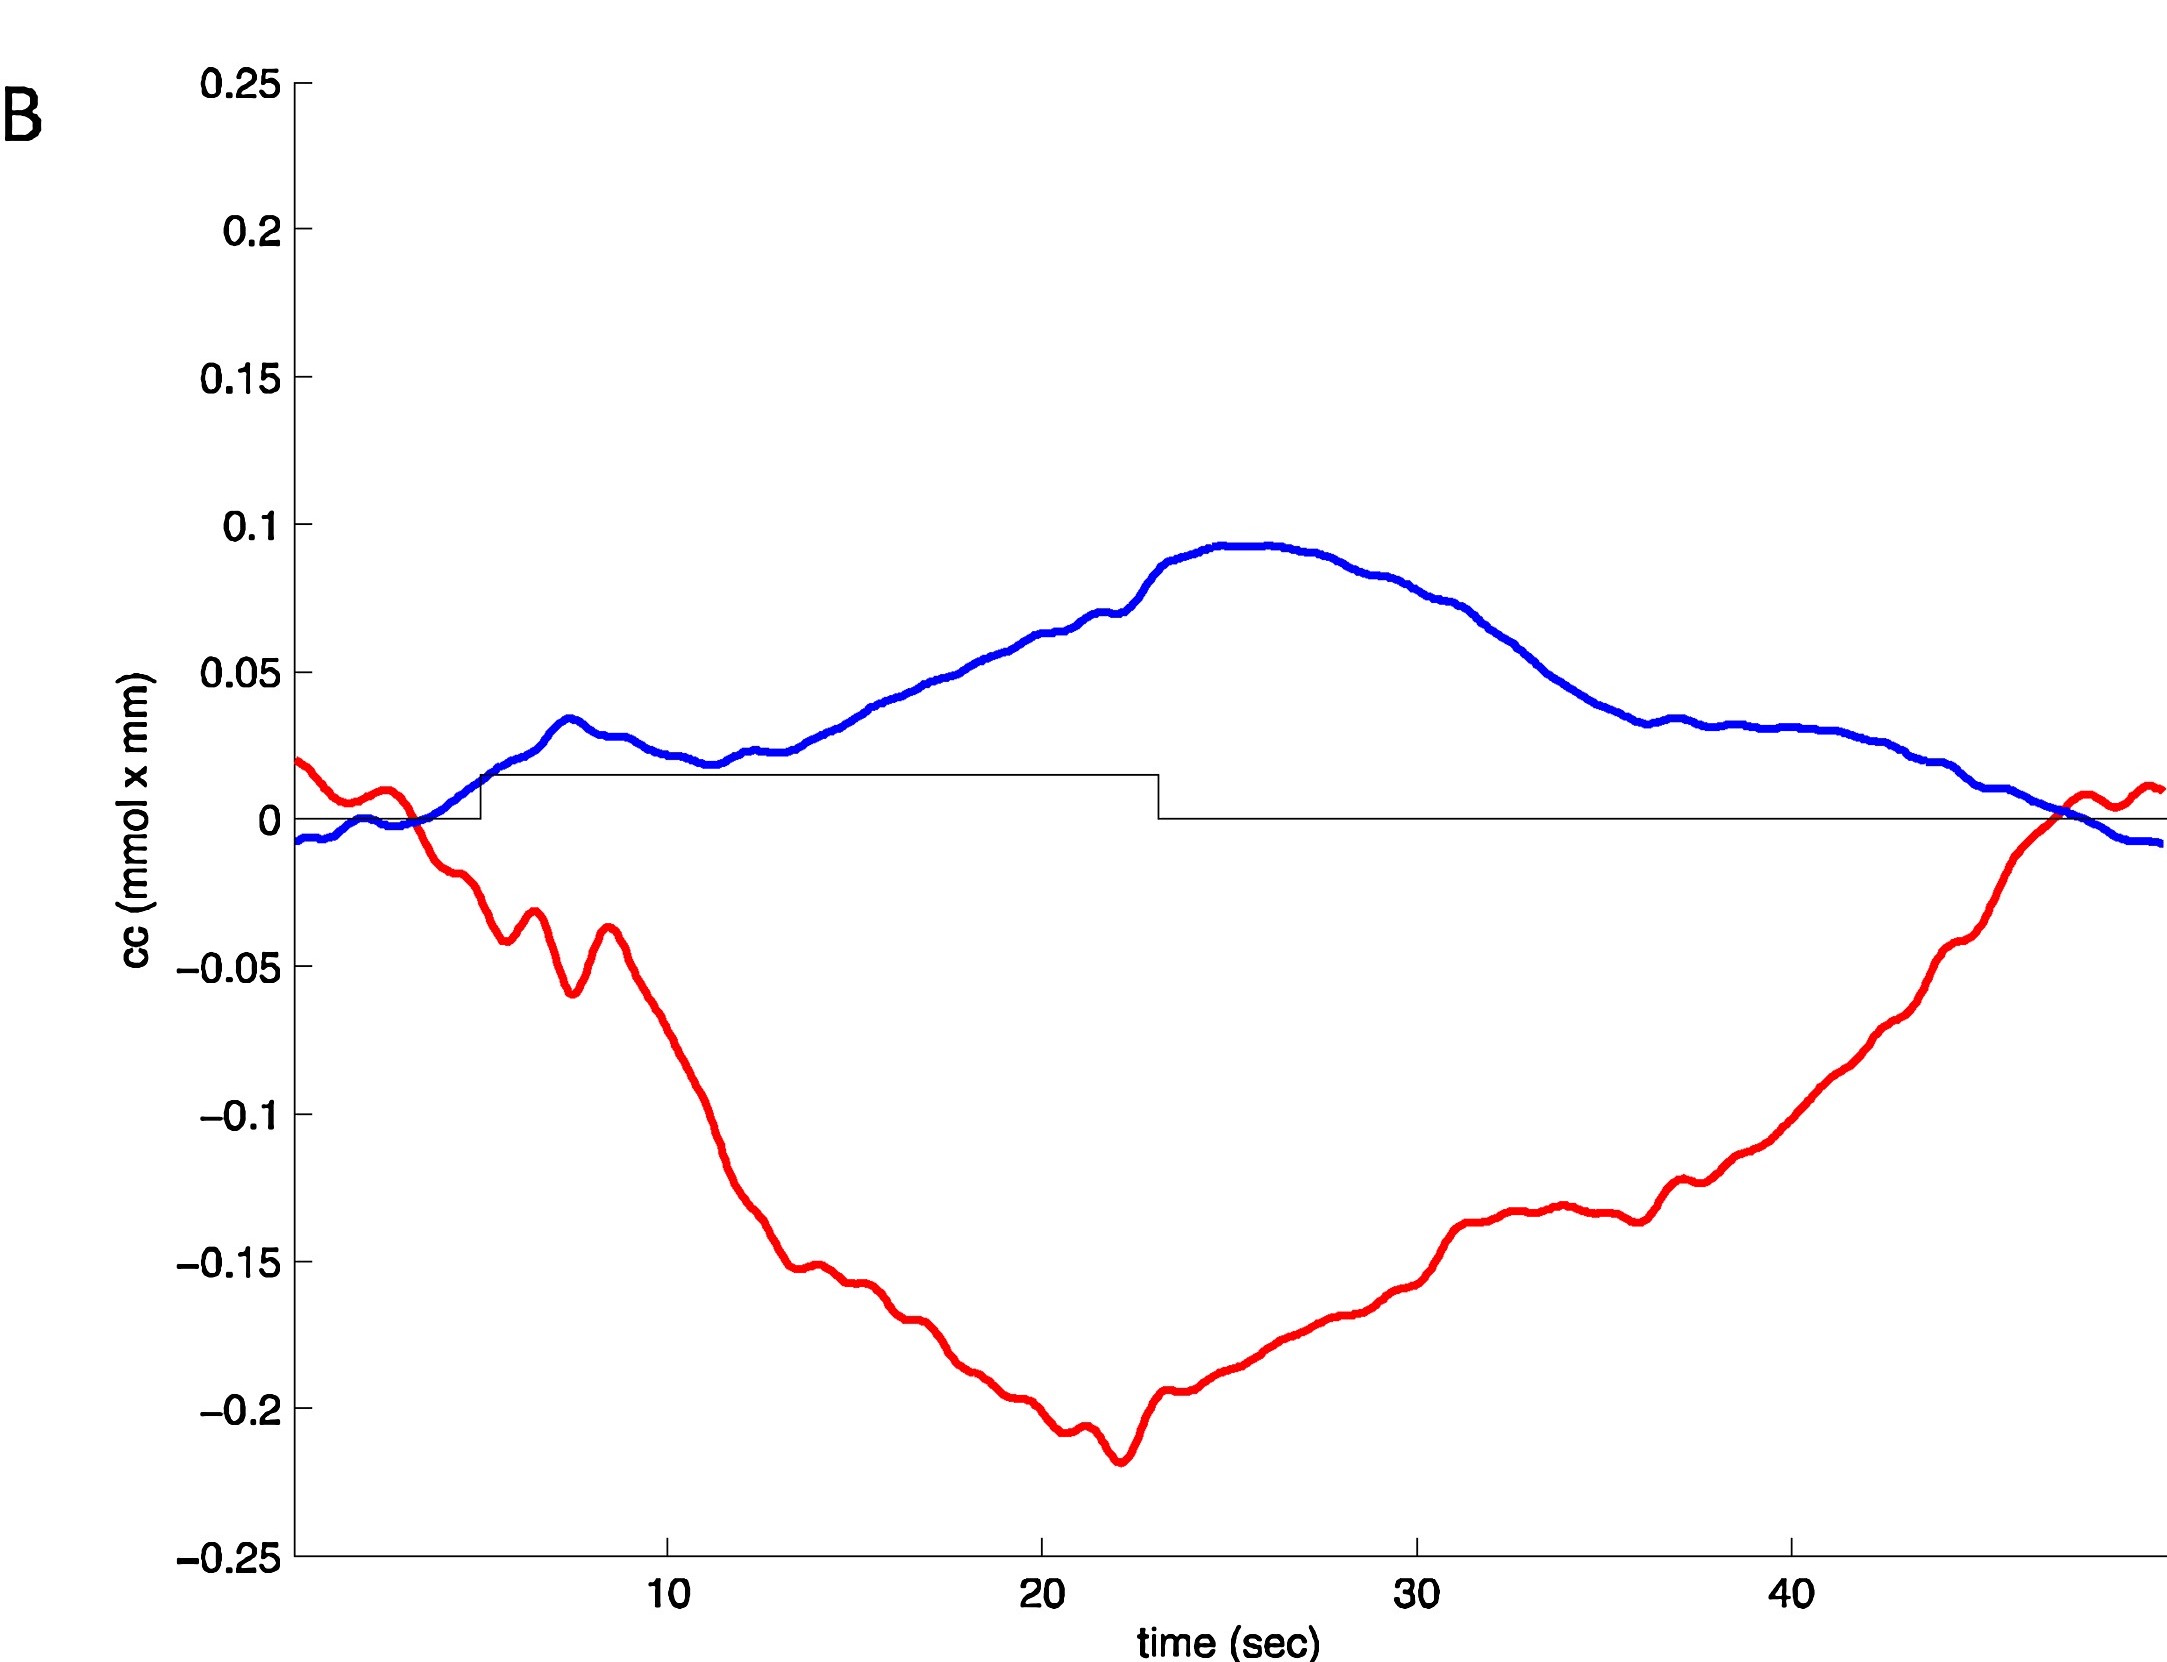
fNIRS in neonates
Canonical response
Inverted response
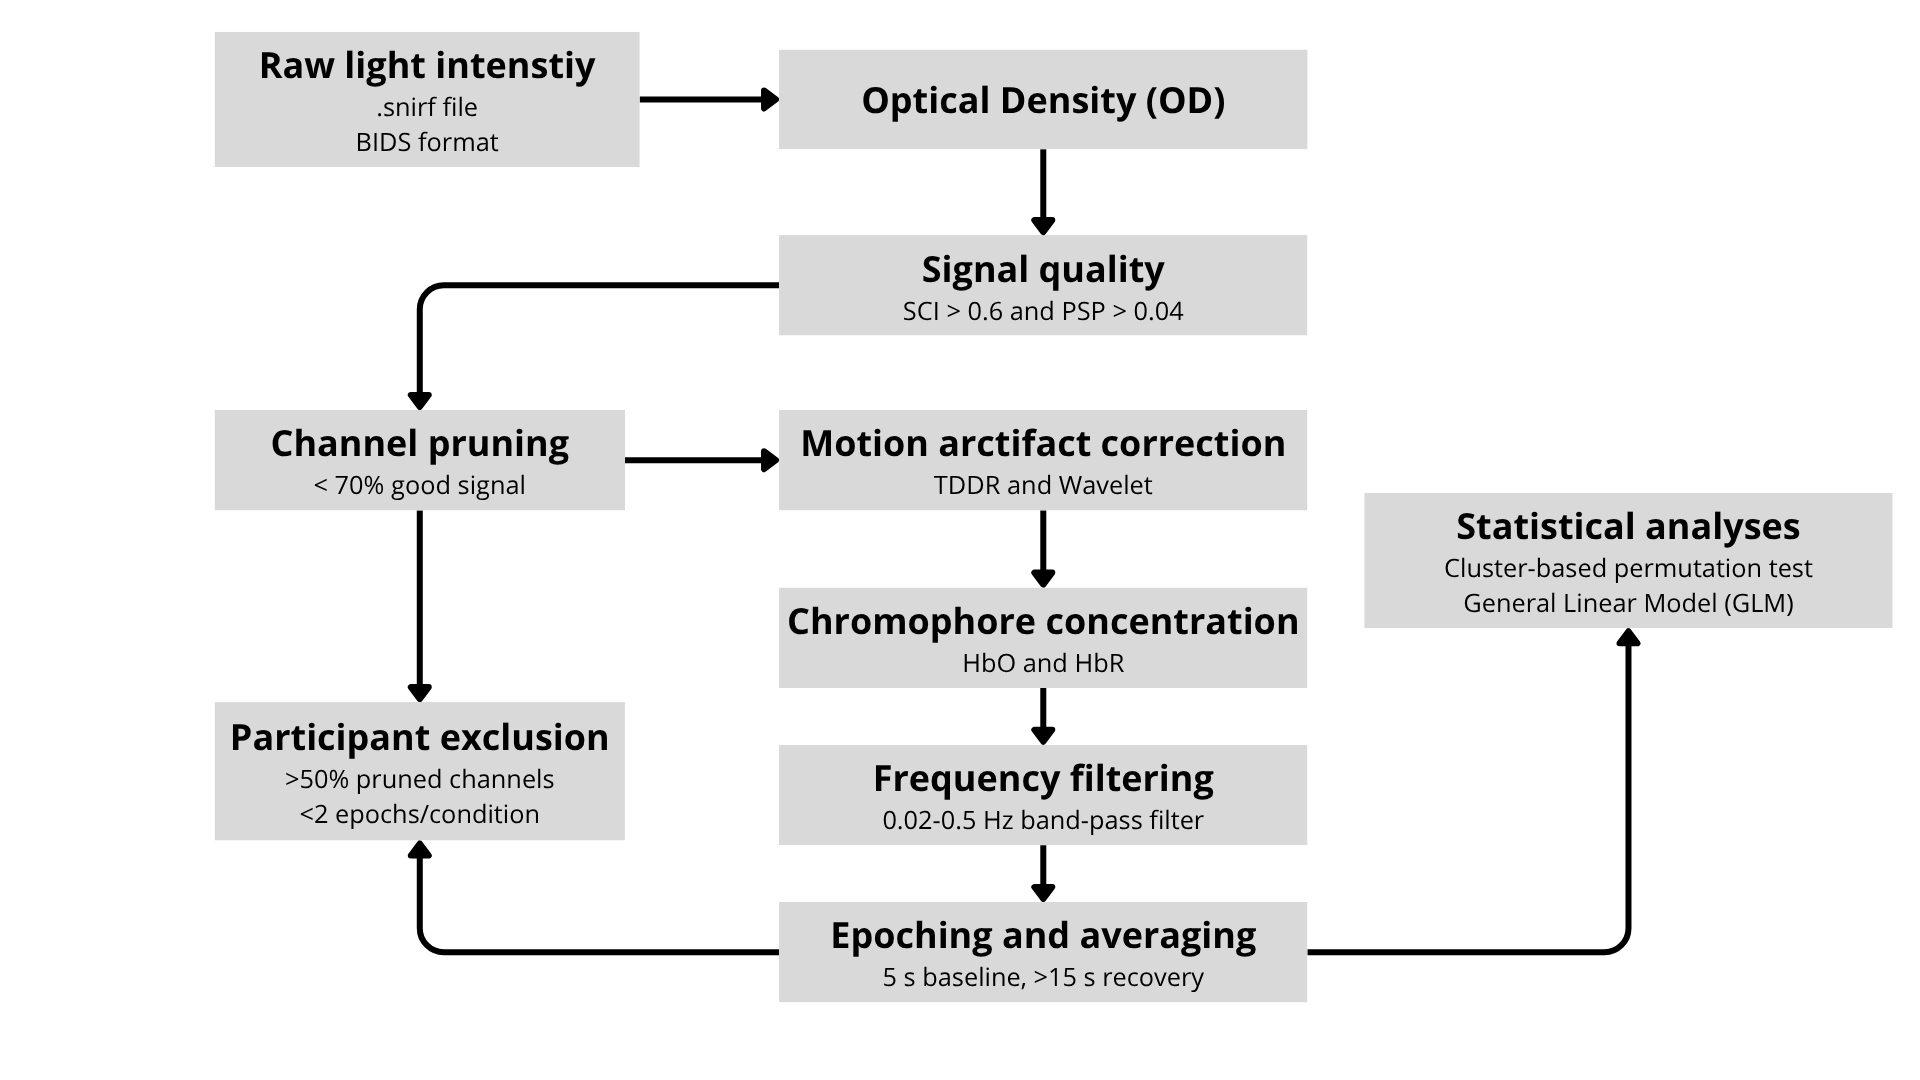
Pipeline suggestion
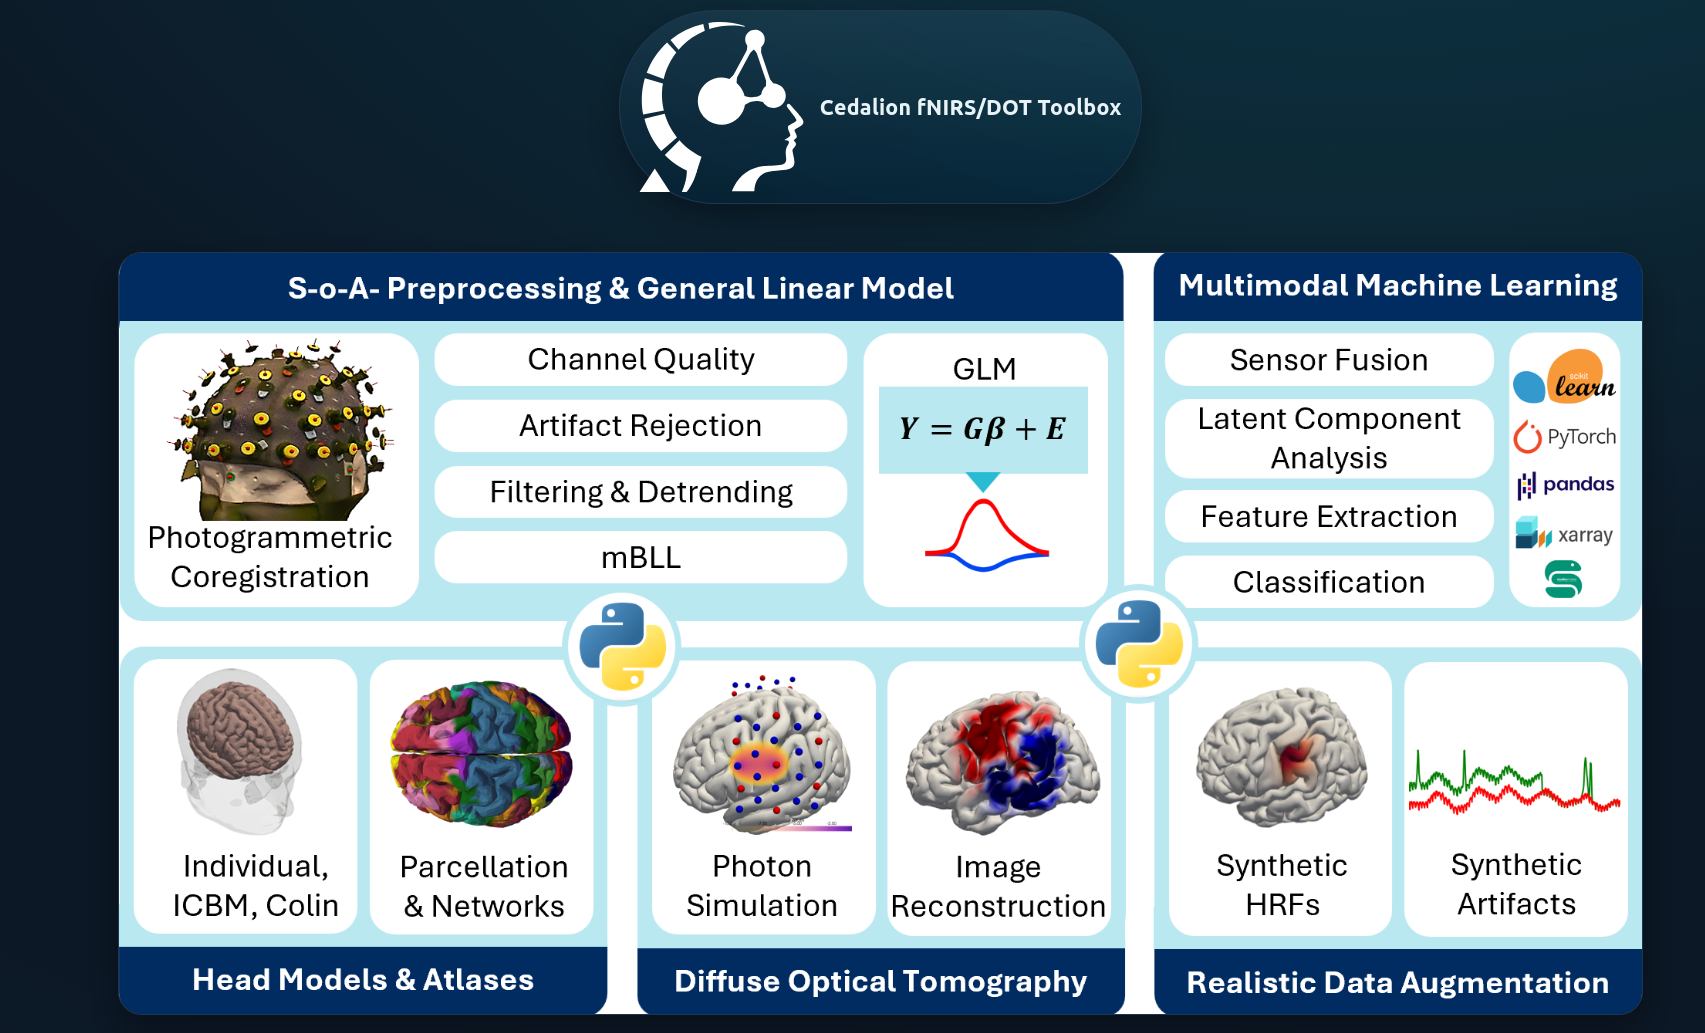
Software
Cedalion (Middell et al. 2026)
Datasets

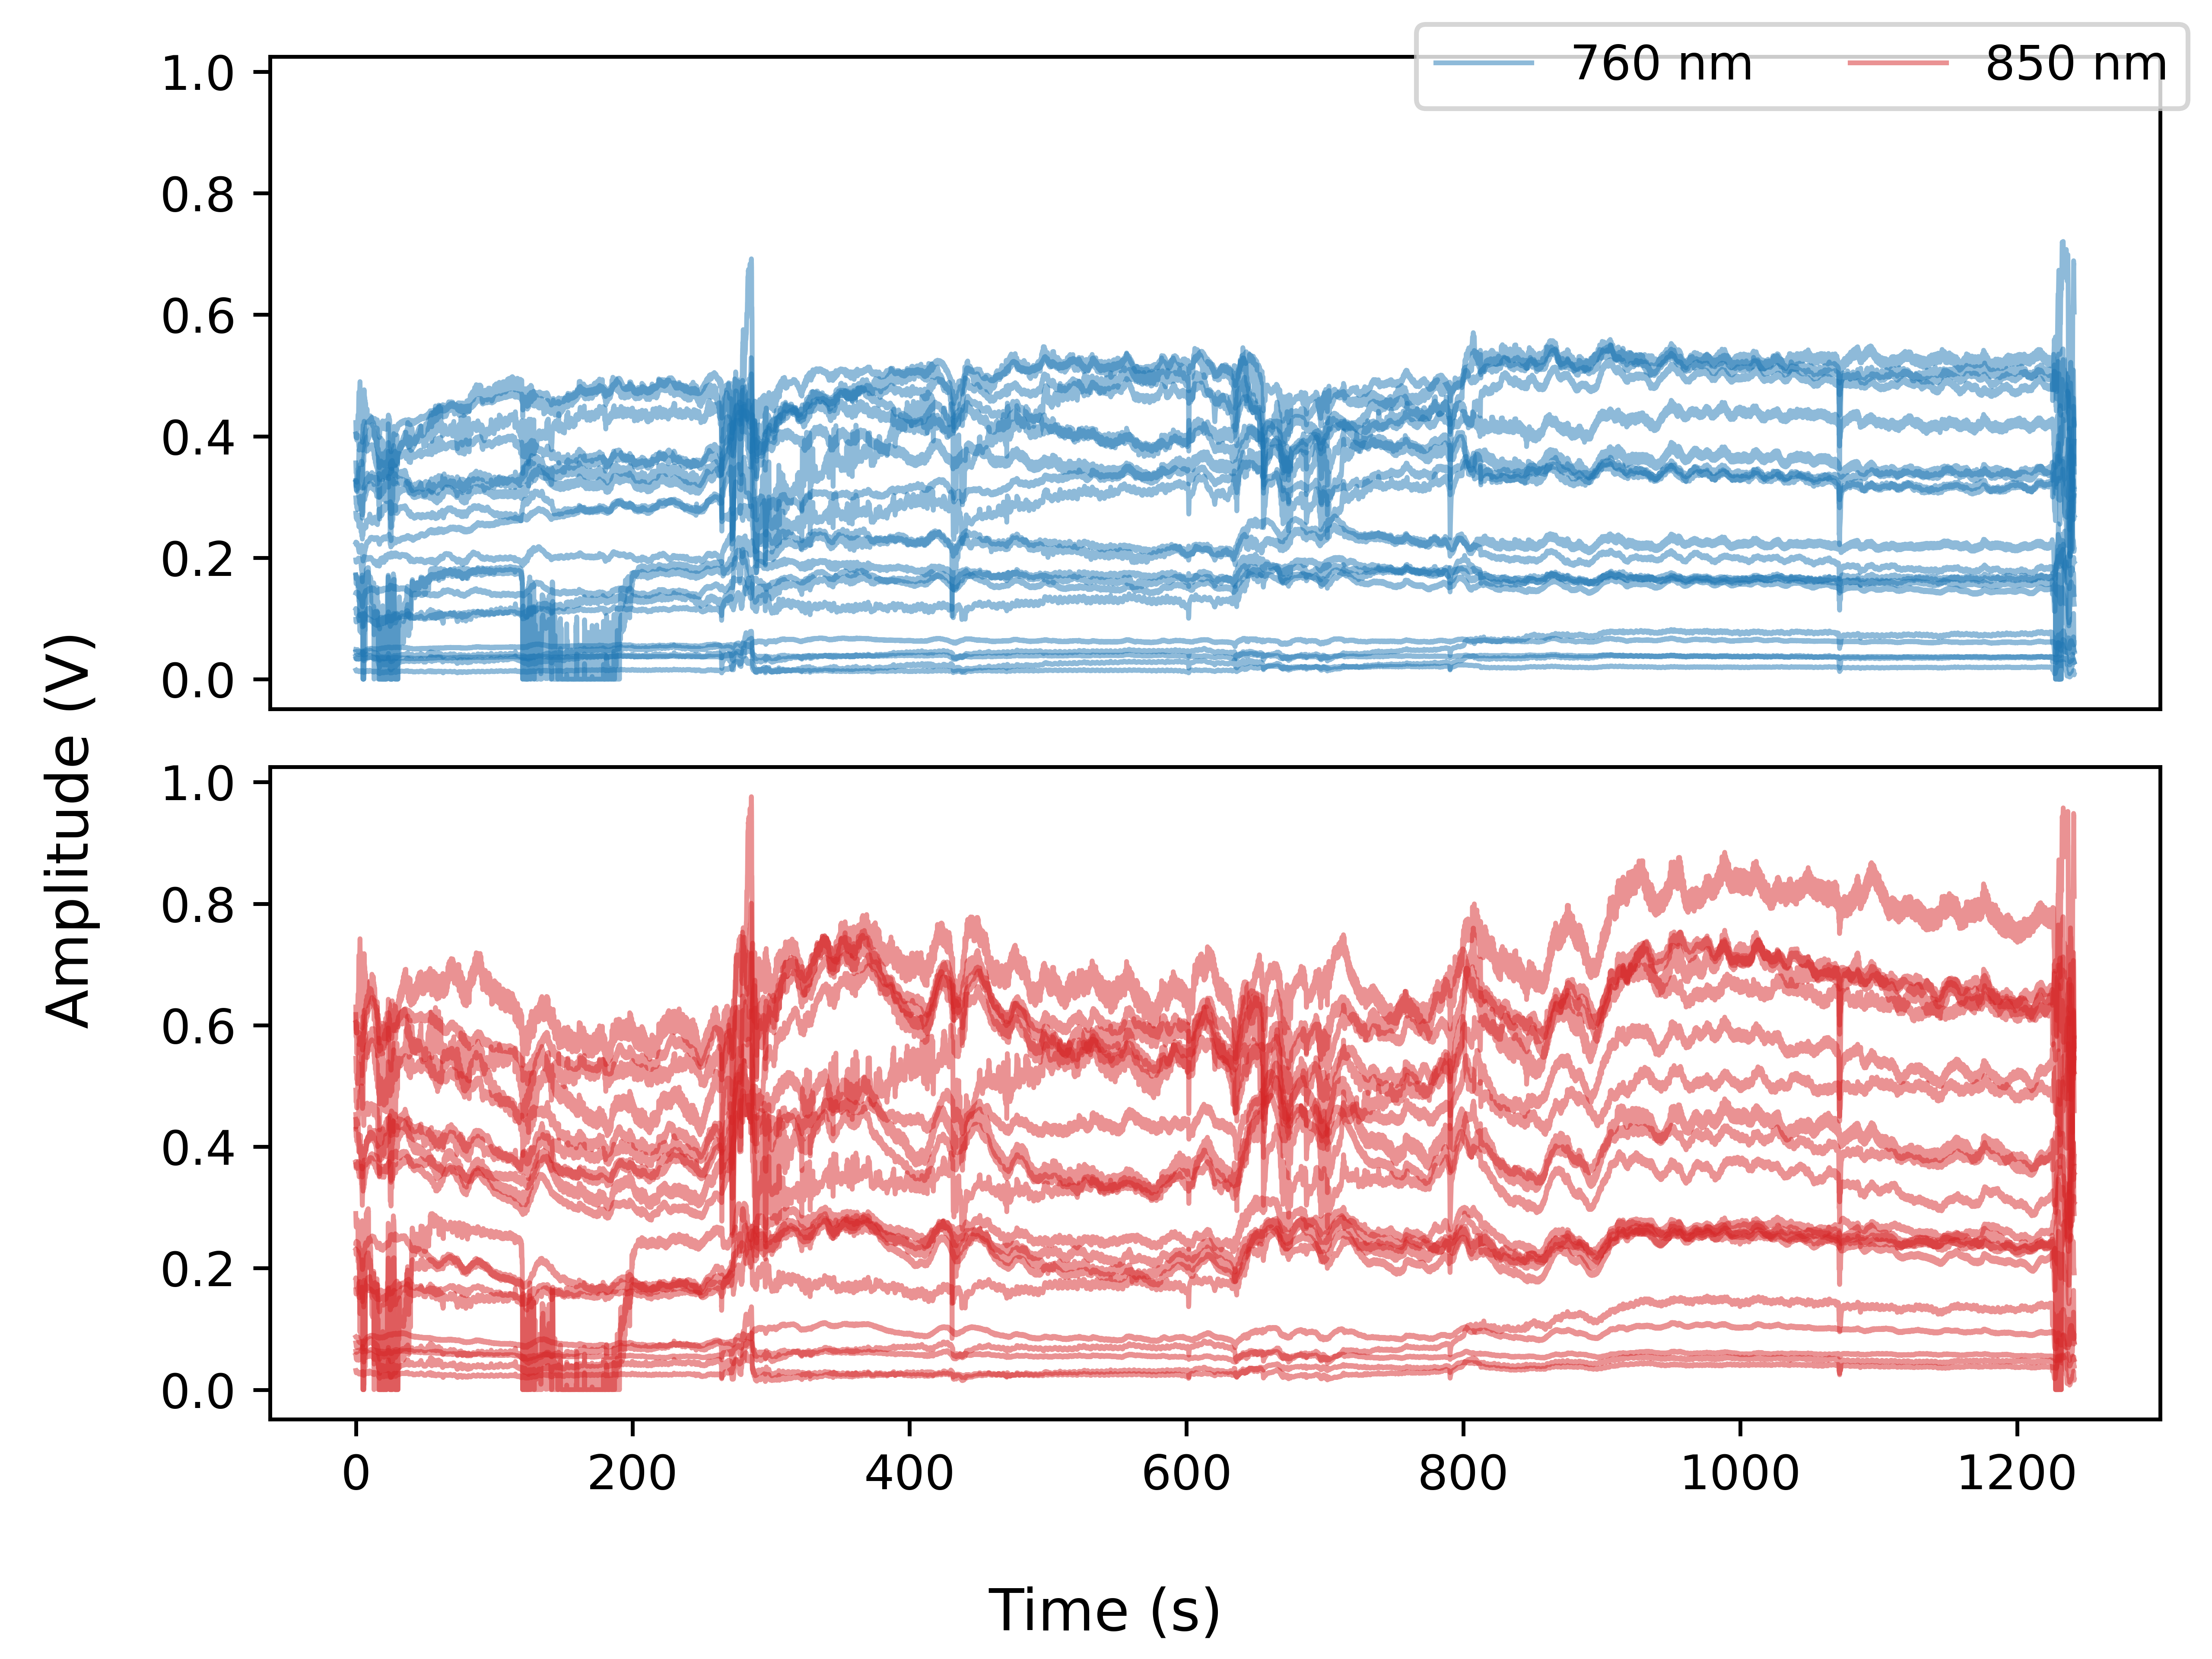
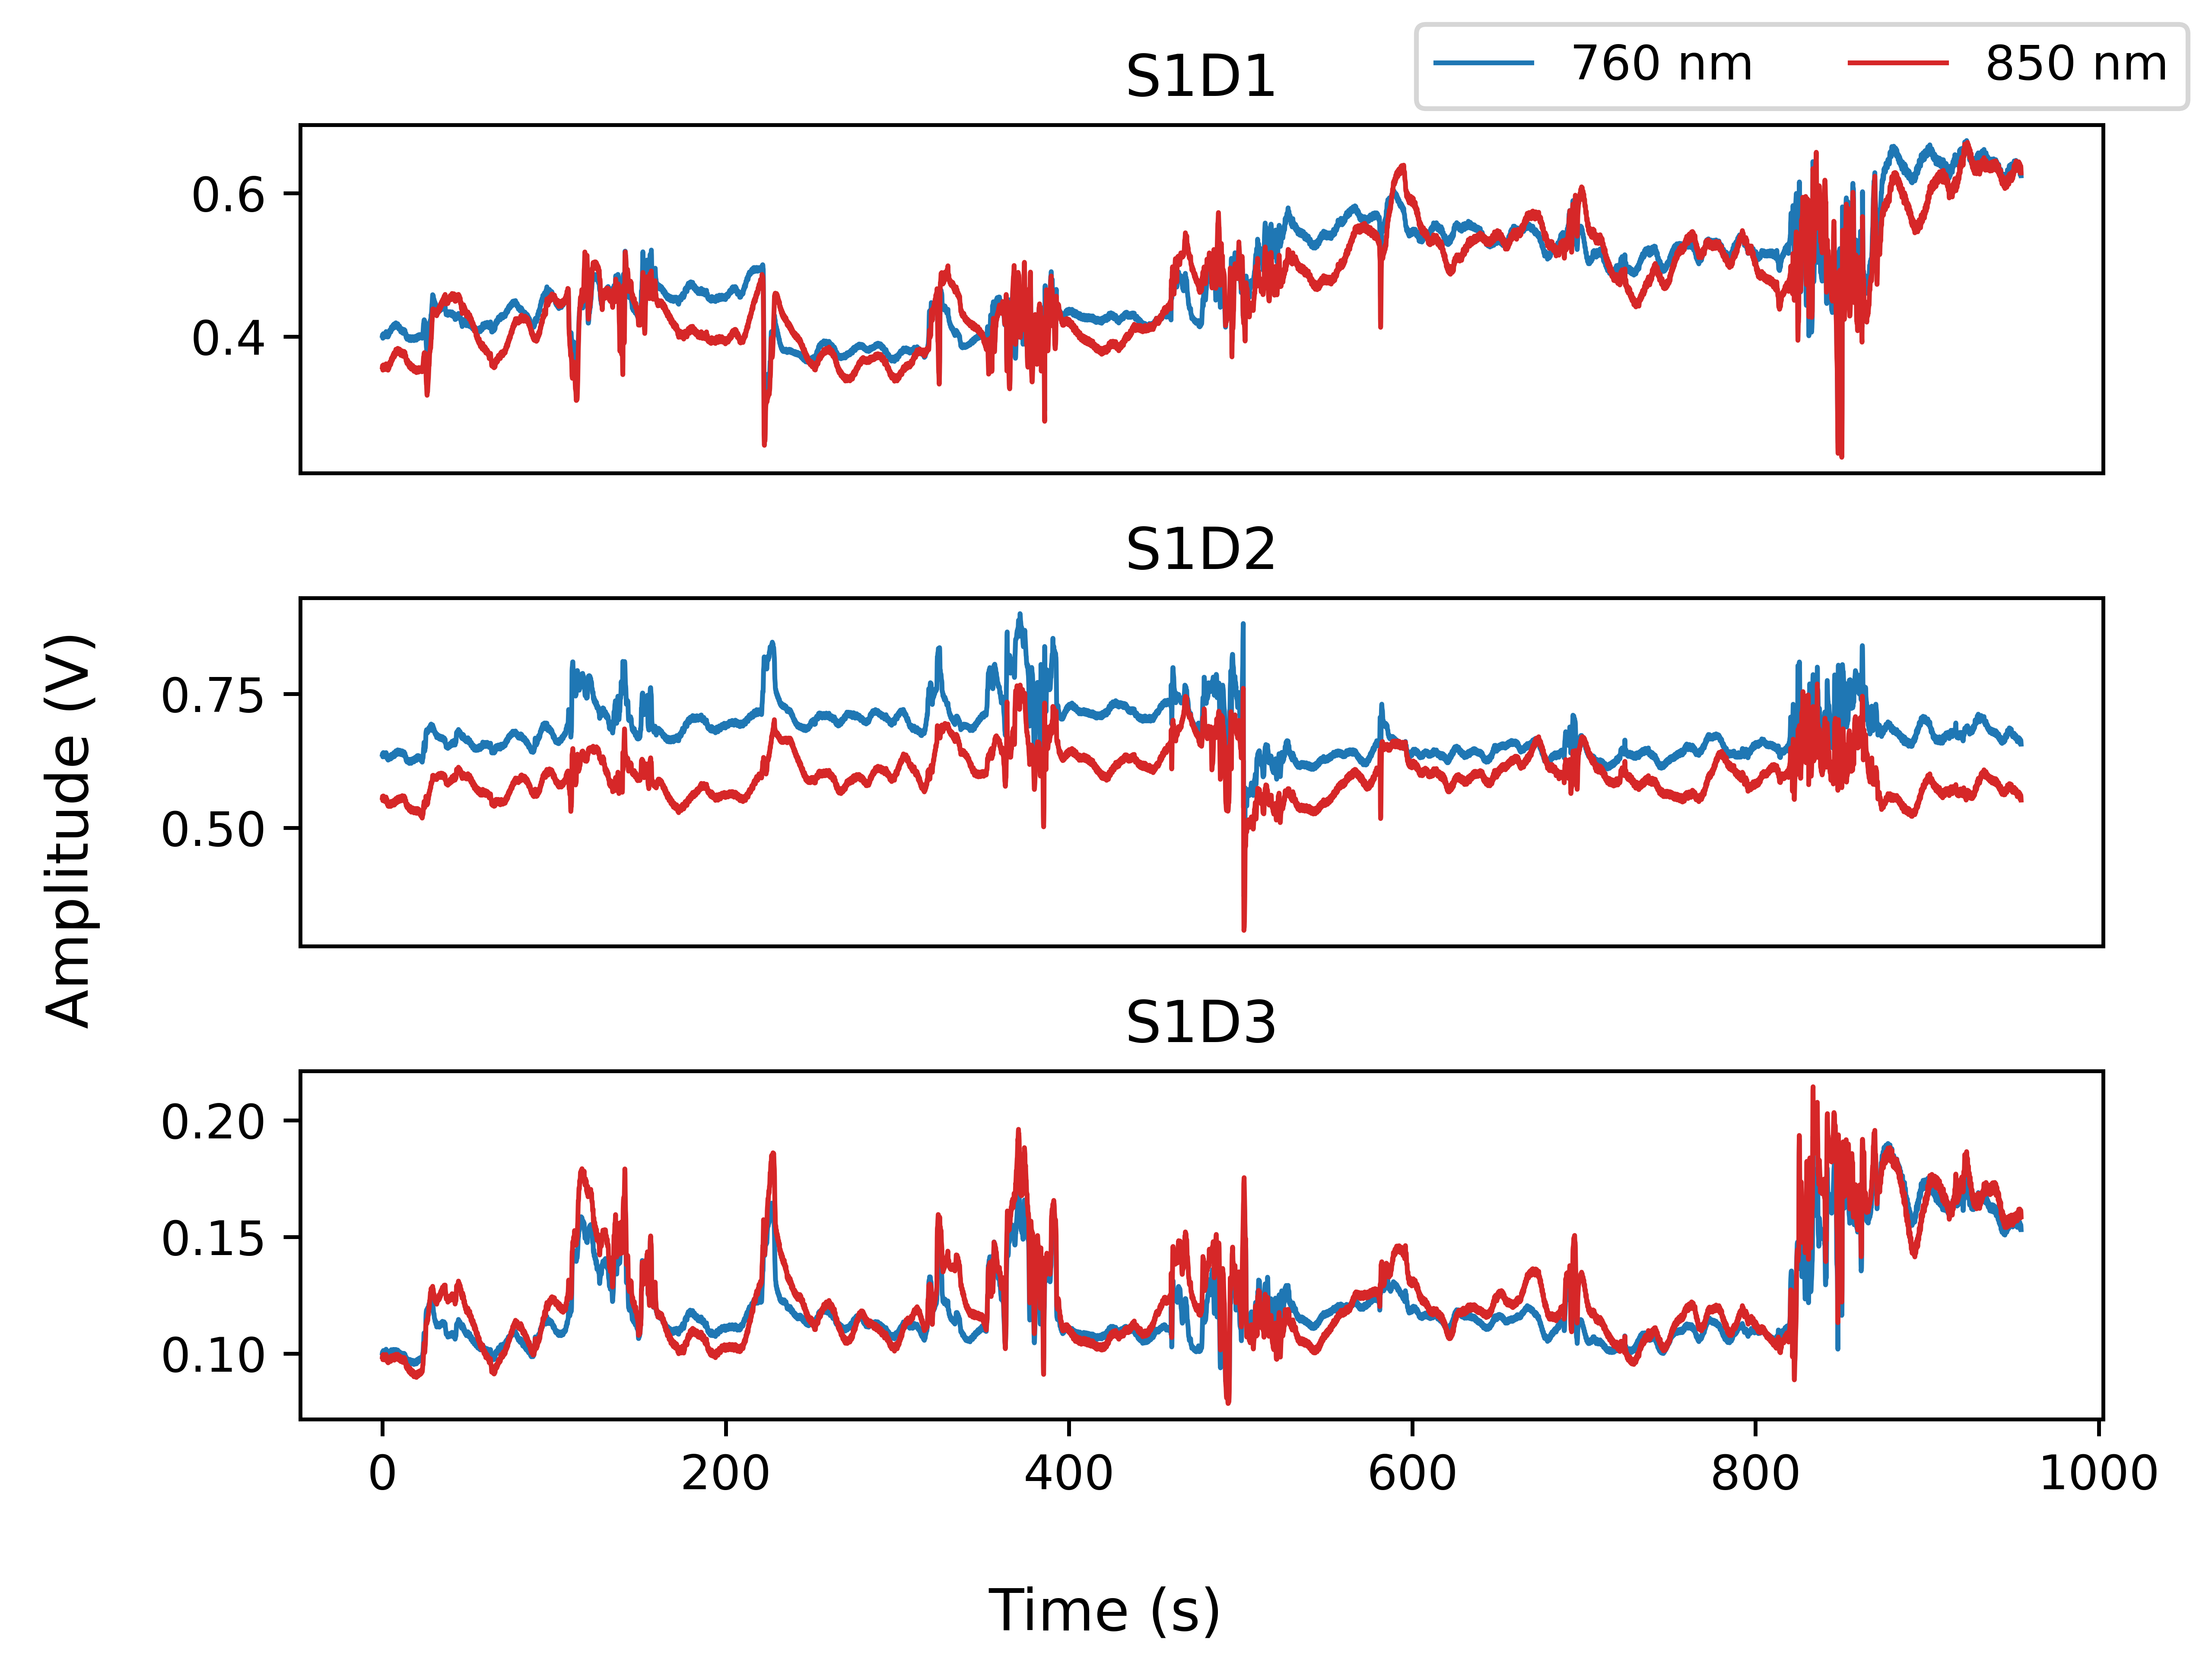
The good: adult data
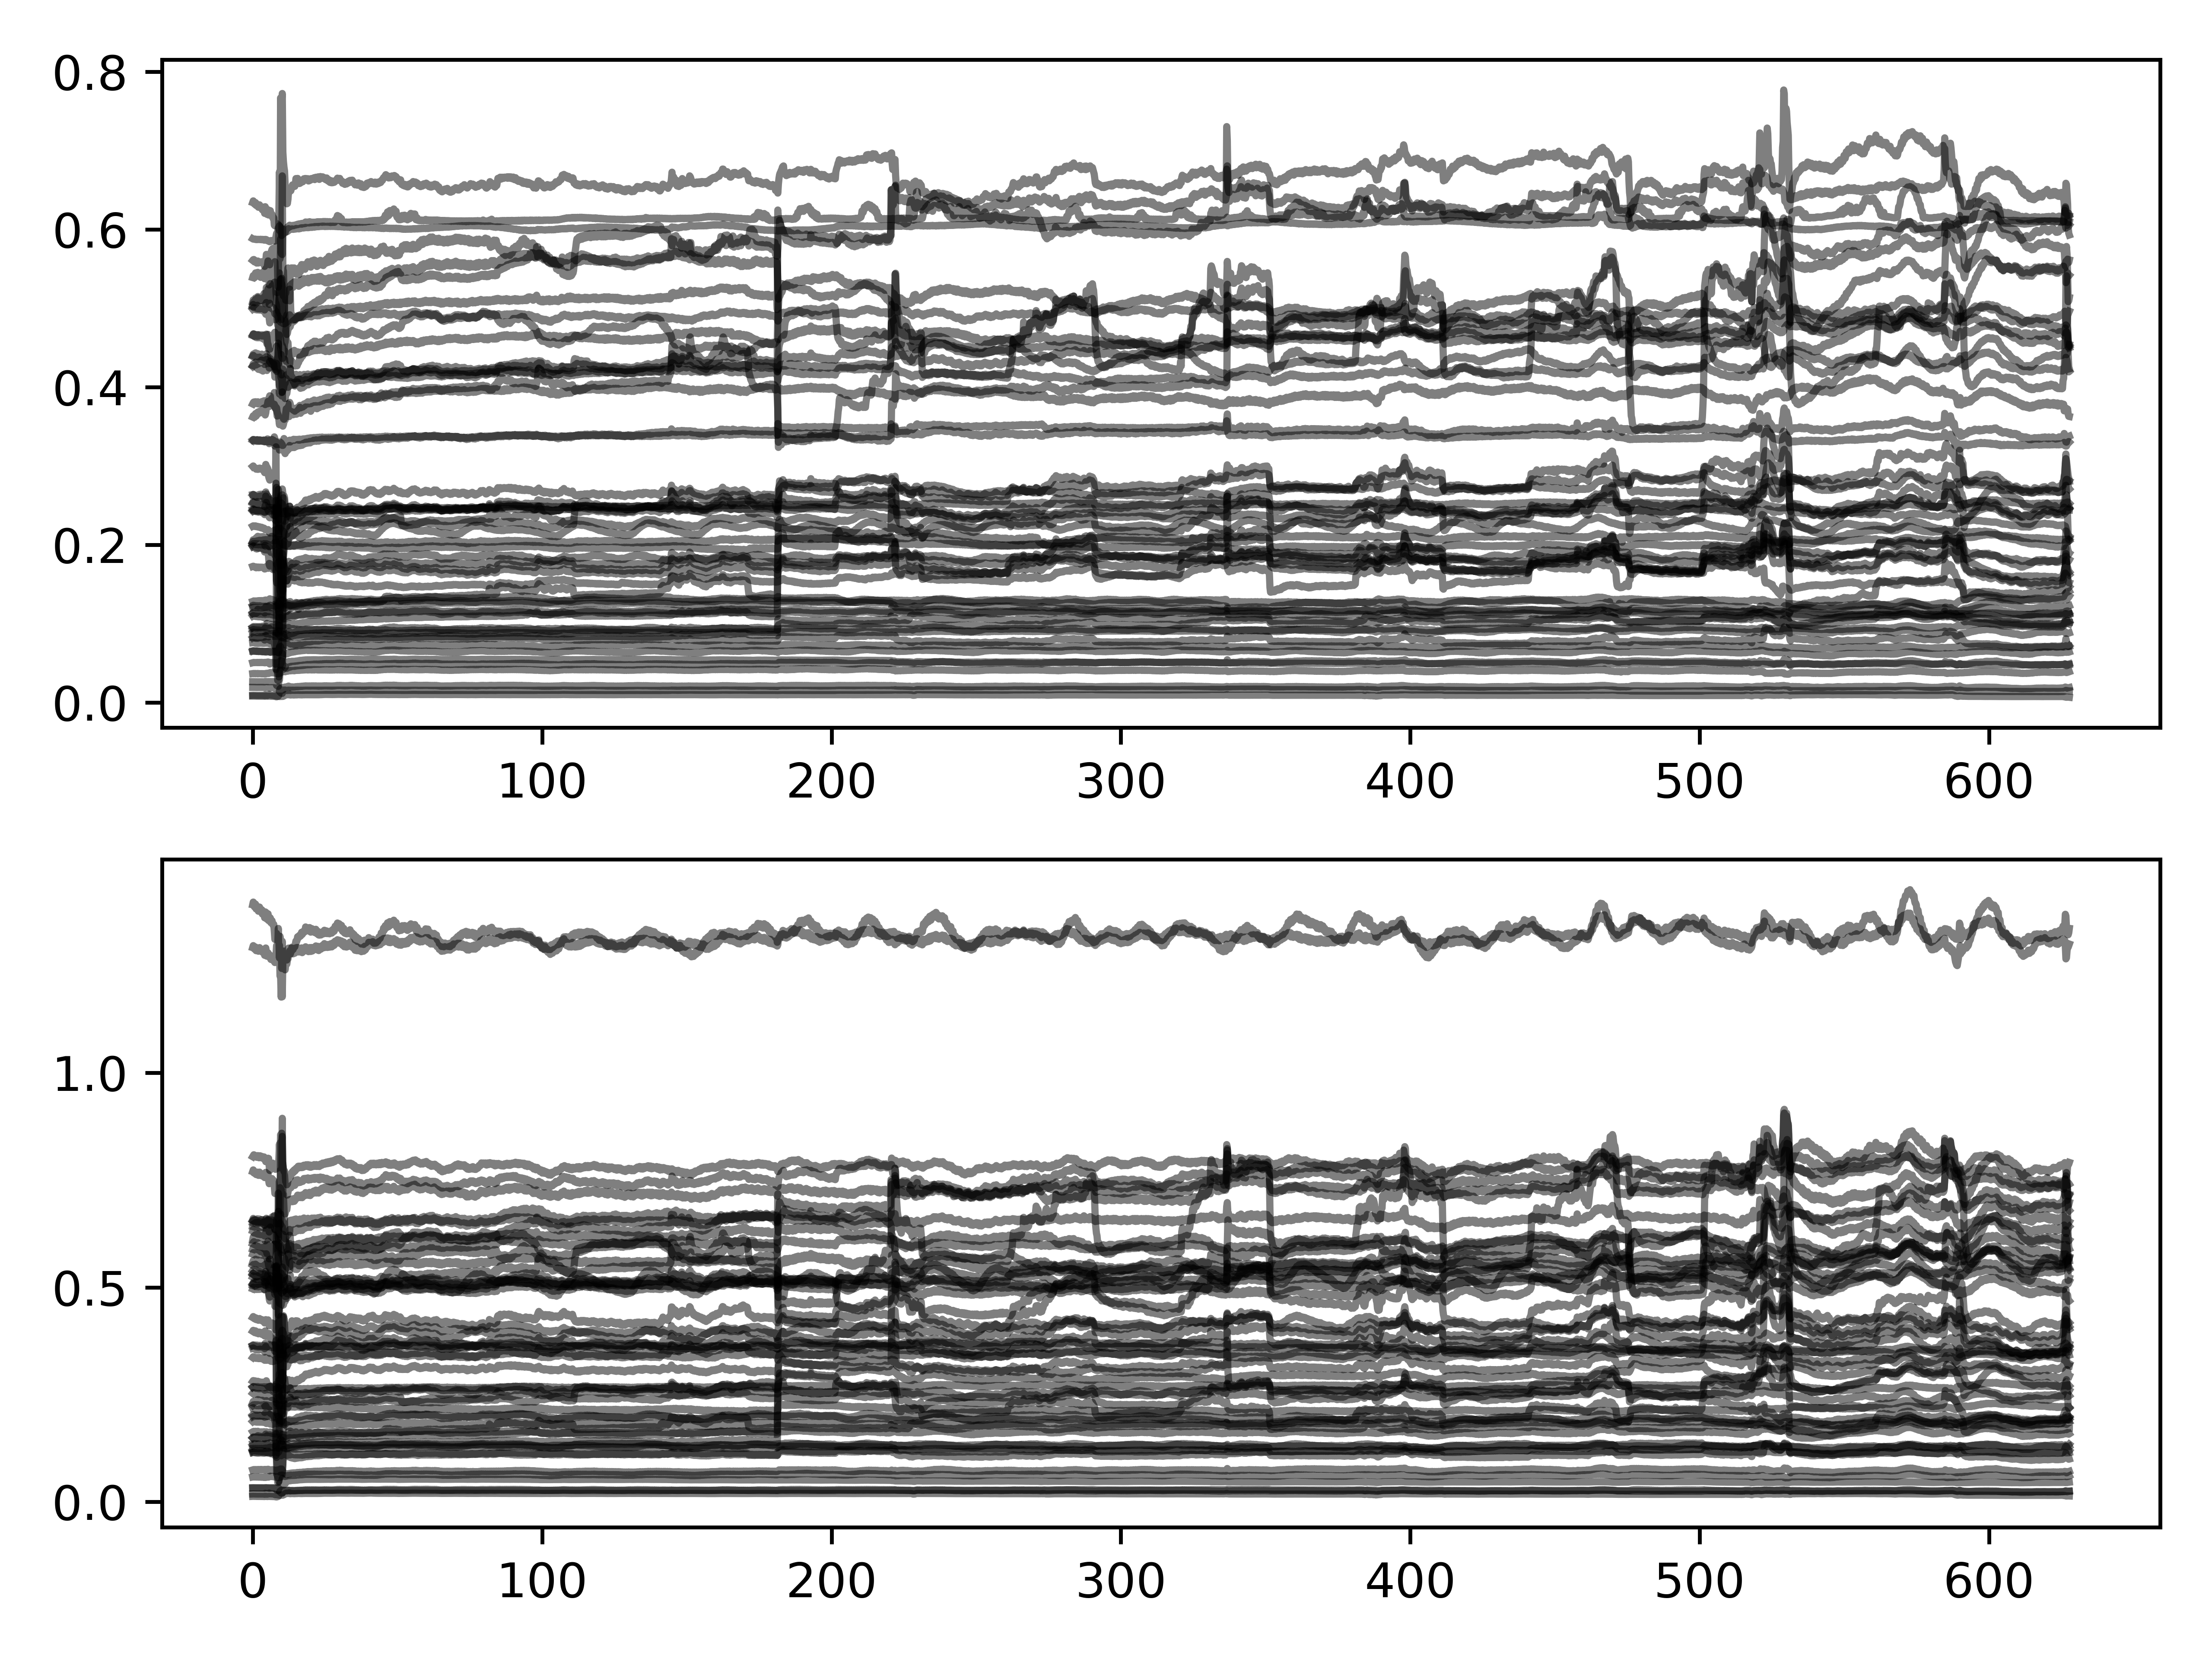
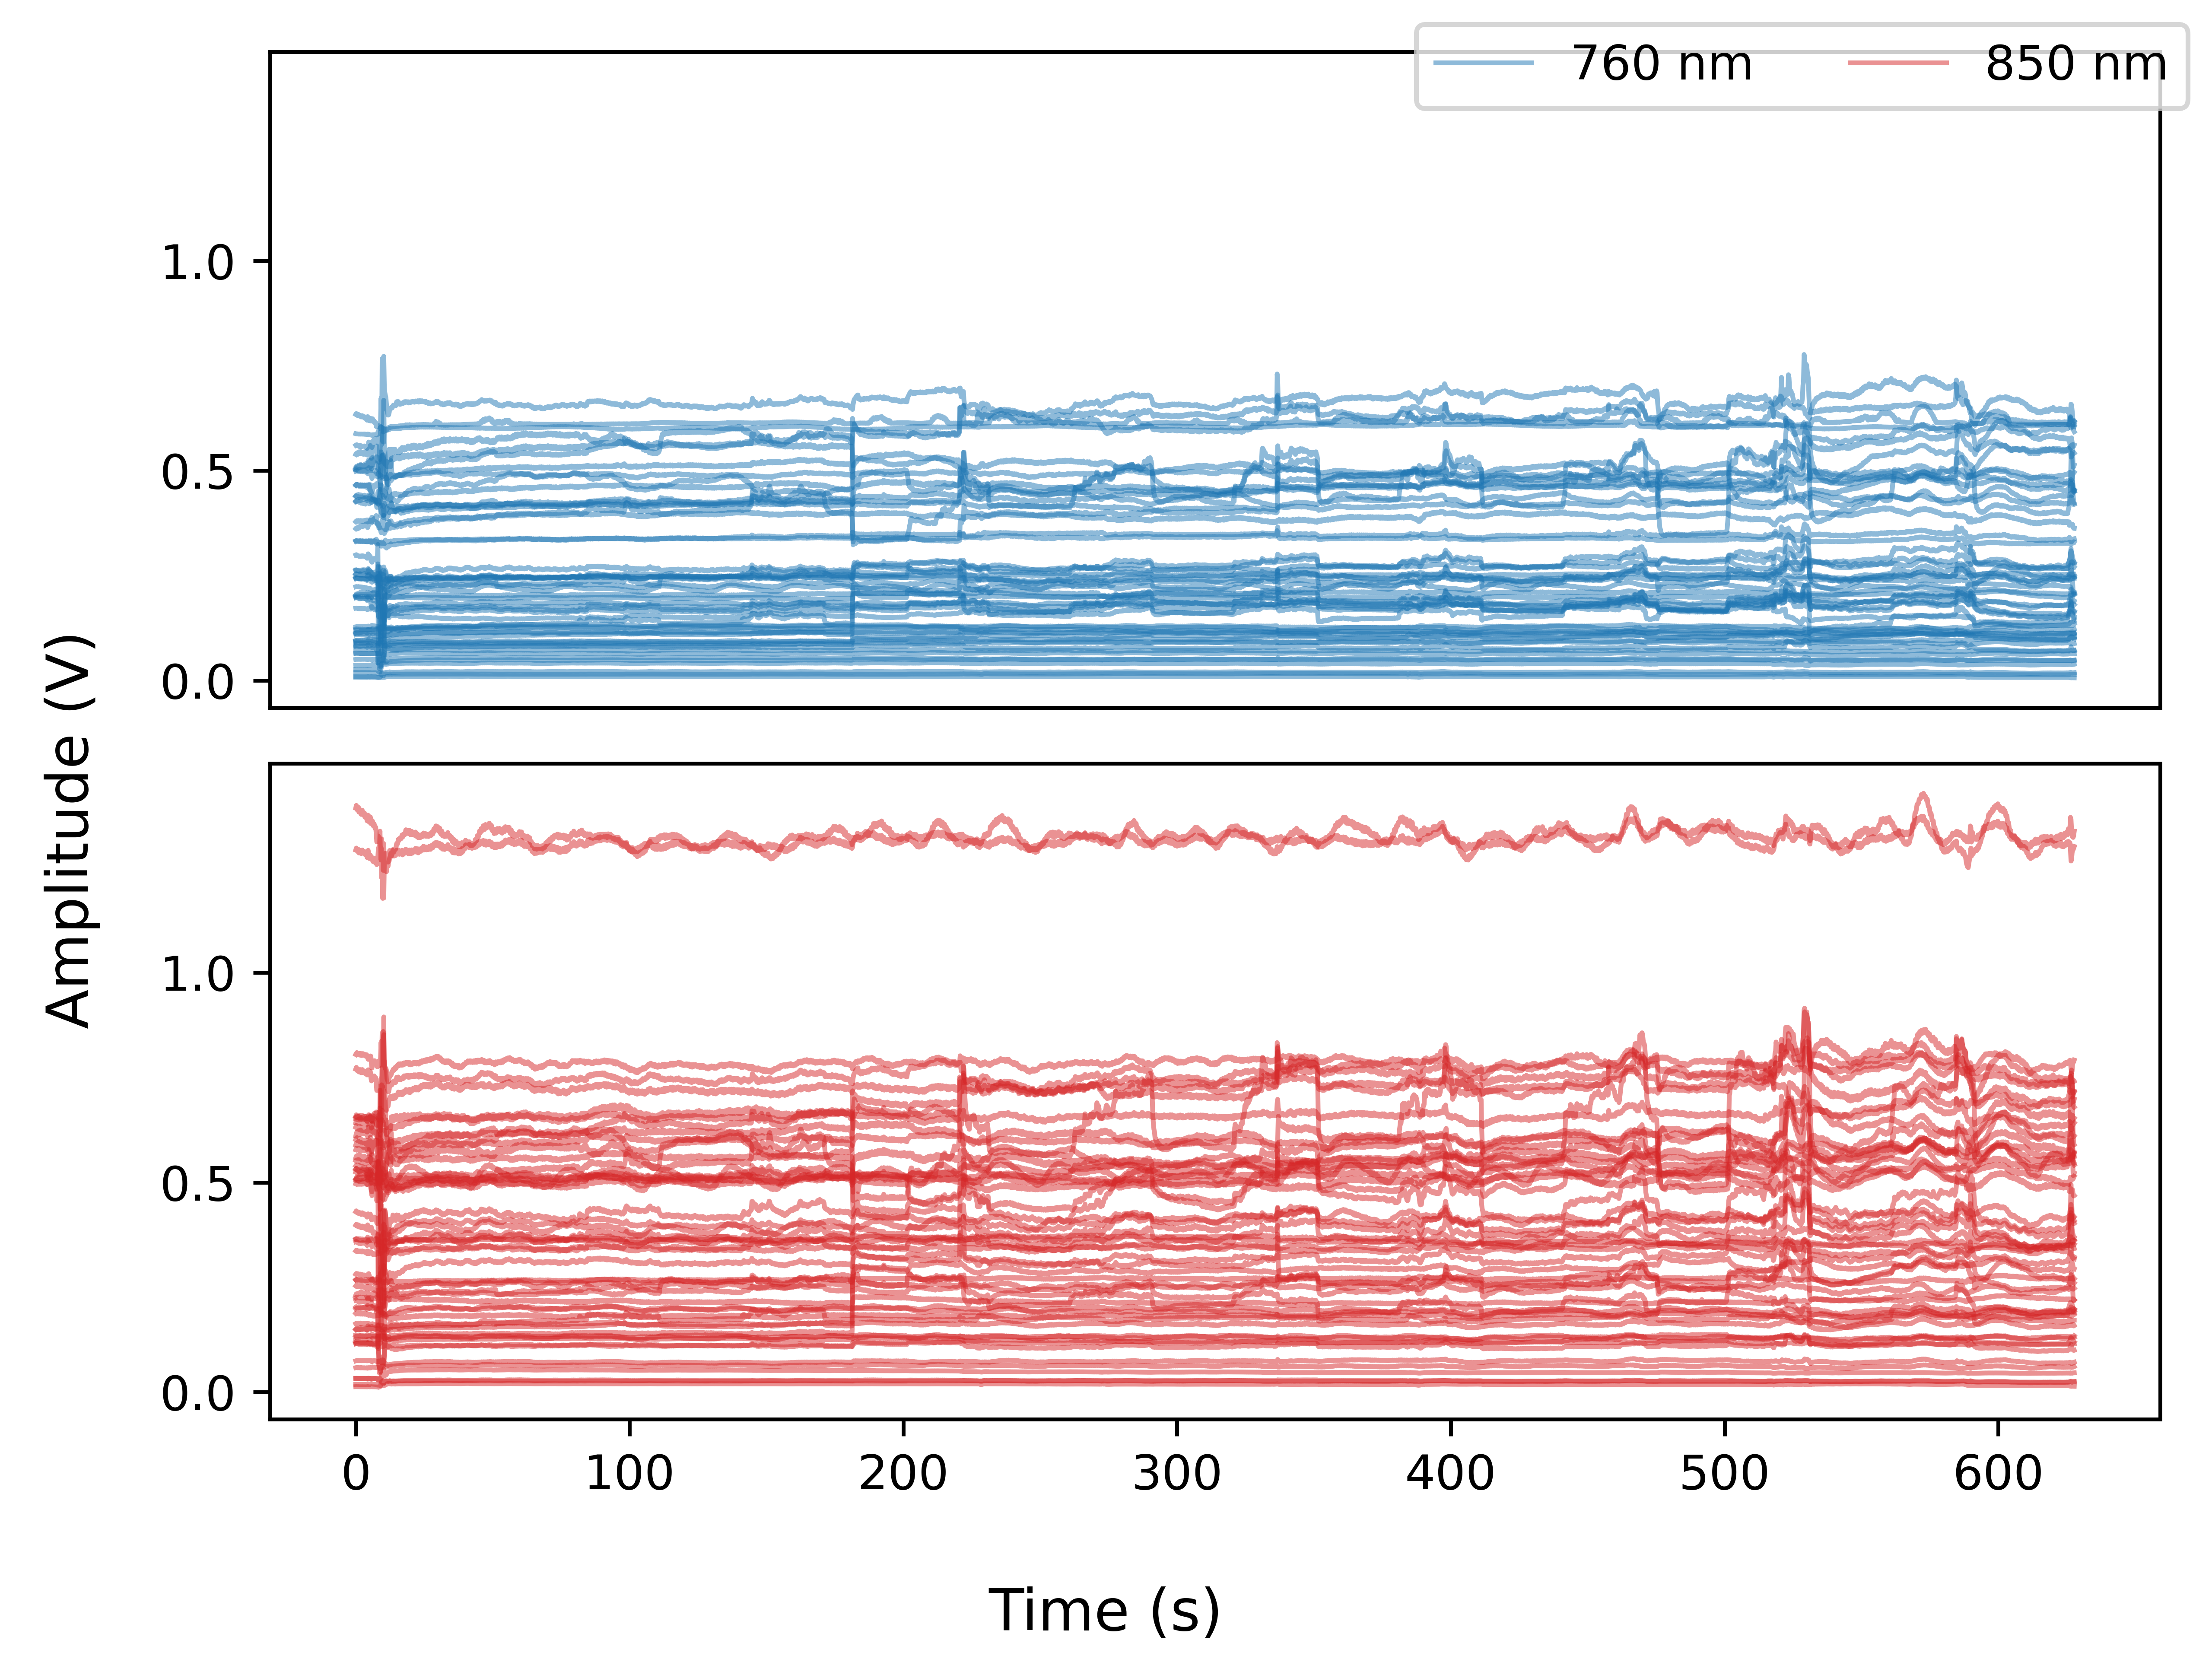
Plotting raw light intensity data with matplotlib:
![]()
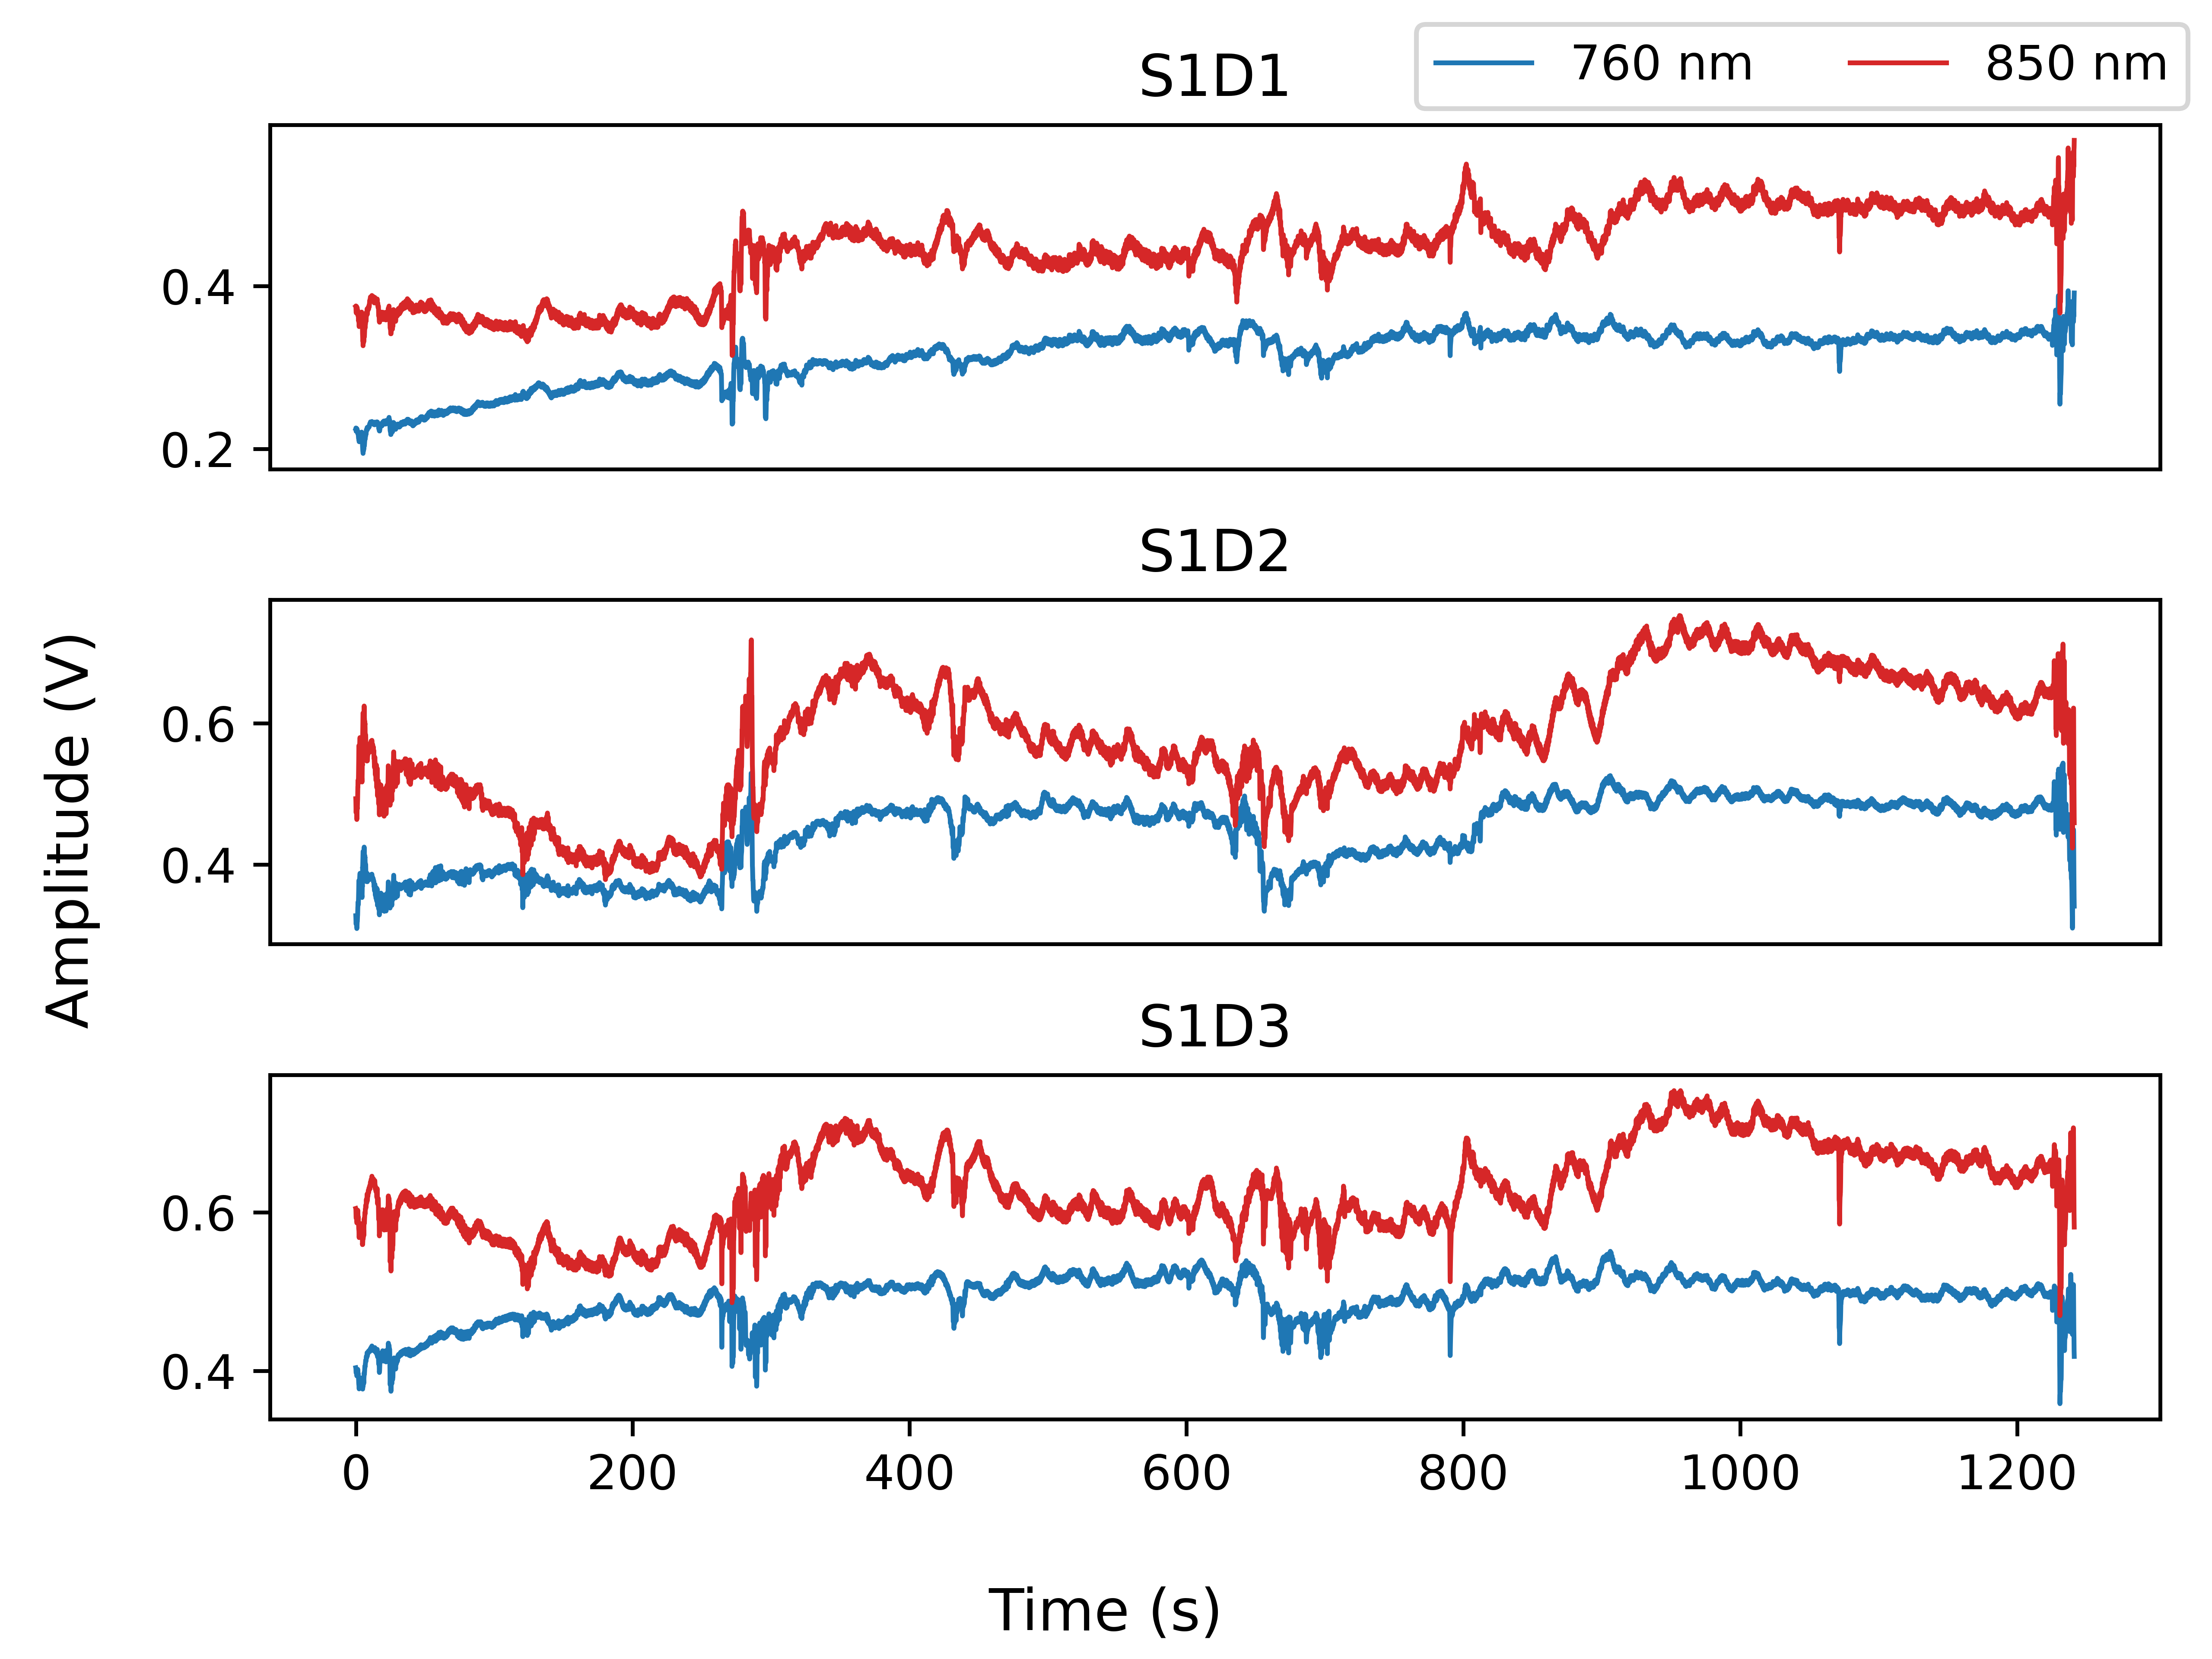
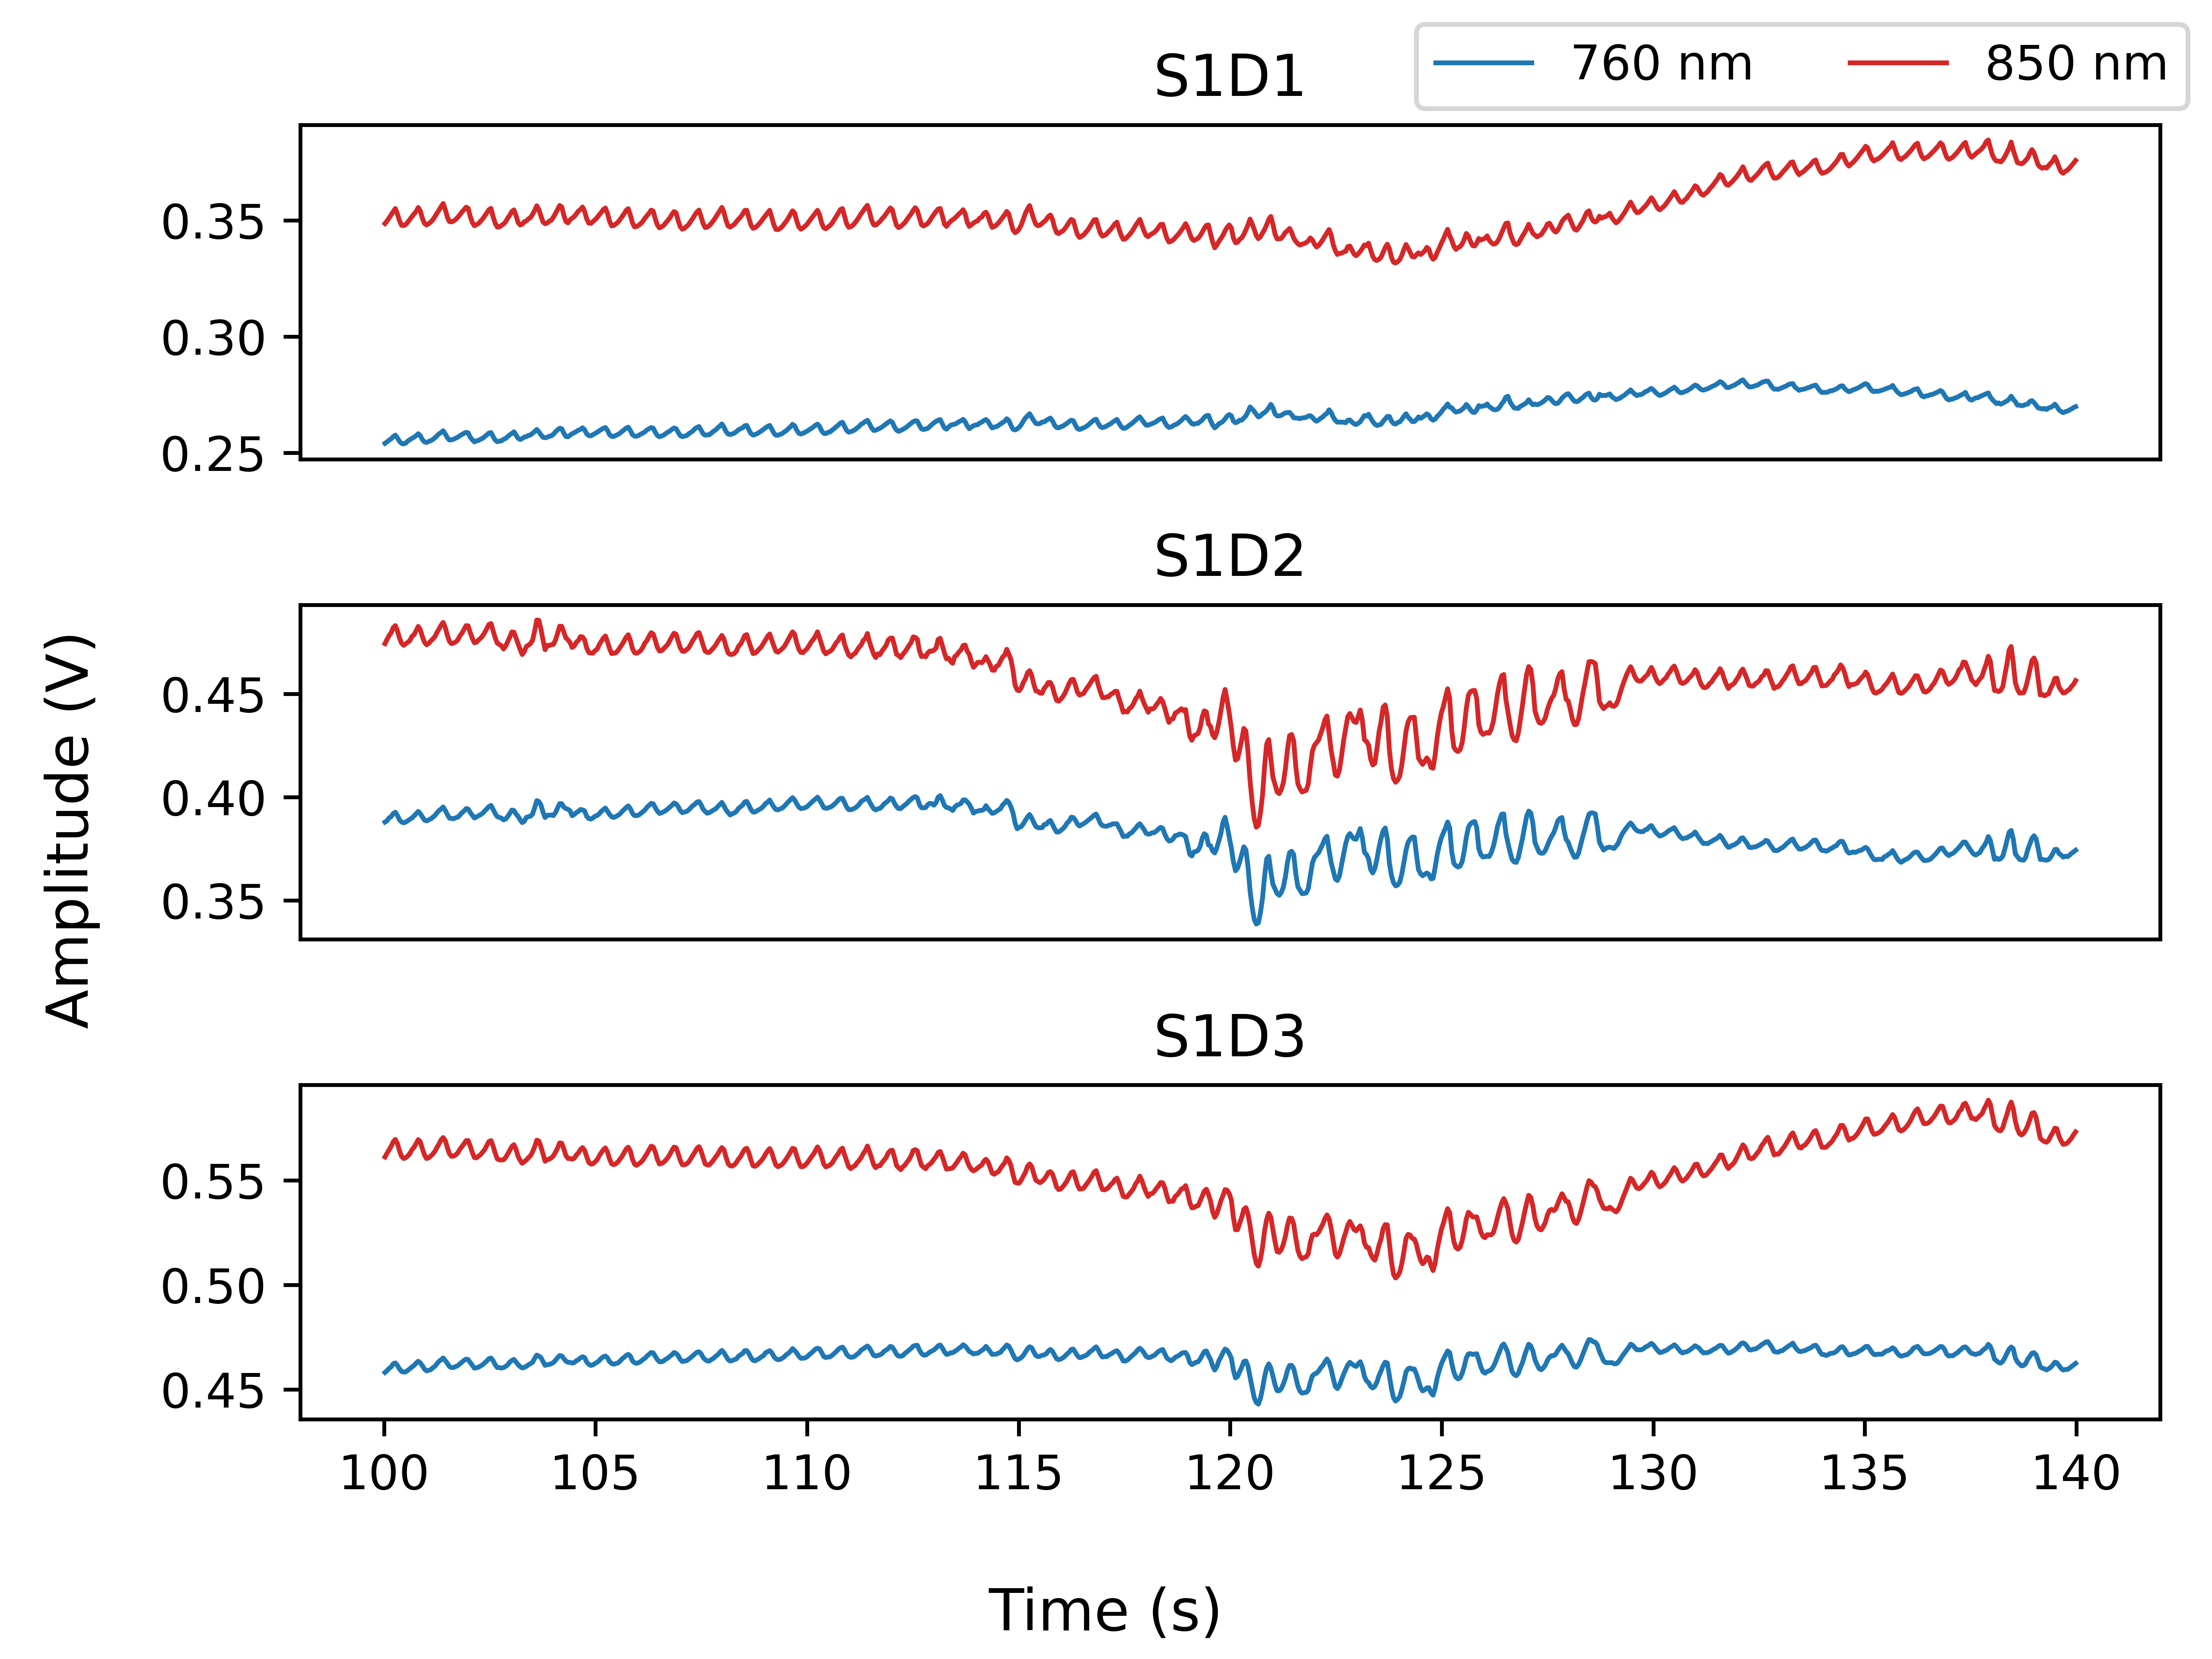
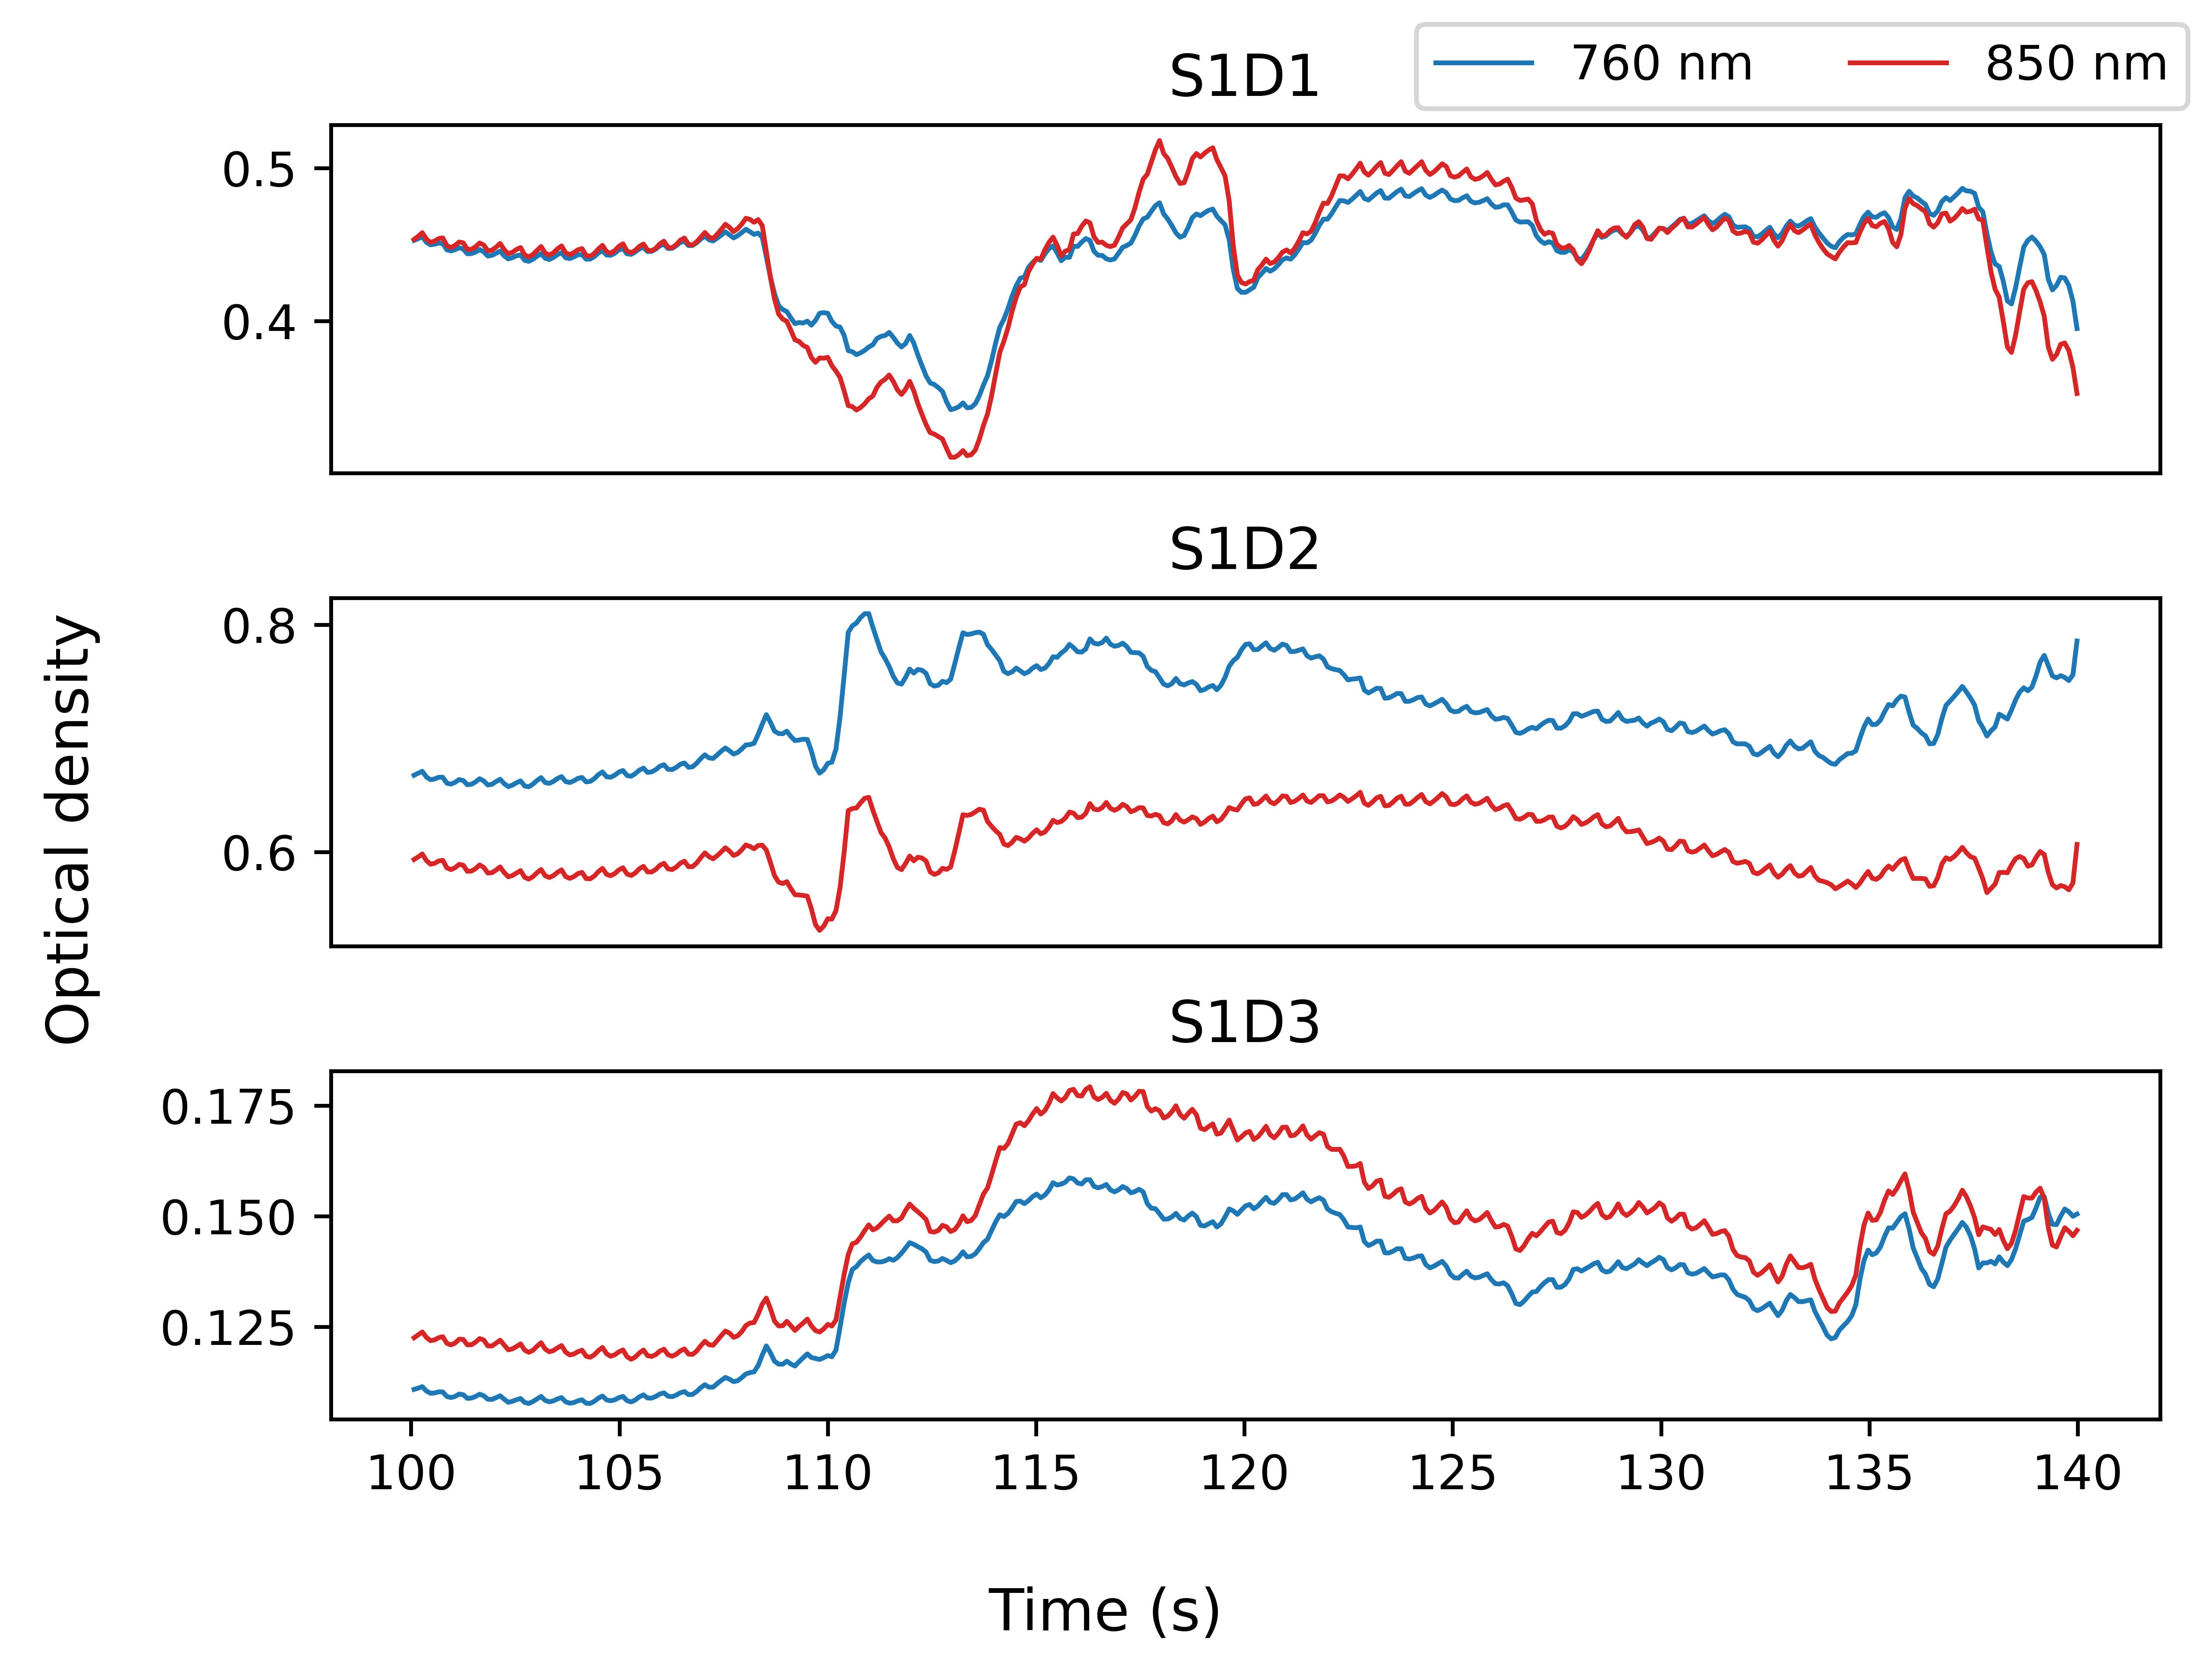
The good: adult data
The good: adult data
The good: adult data
The good: adult data
The bad: breastfeeding neonate
The bad: breastfeeding neonate
The bad: breastfeeding neonate
The ugly: sleeping neonate
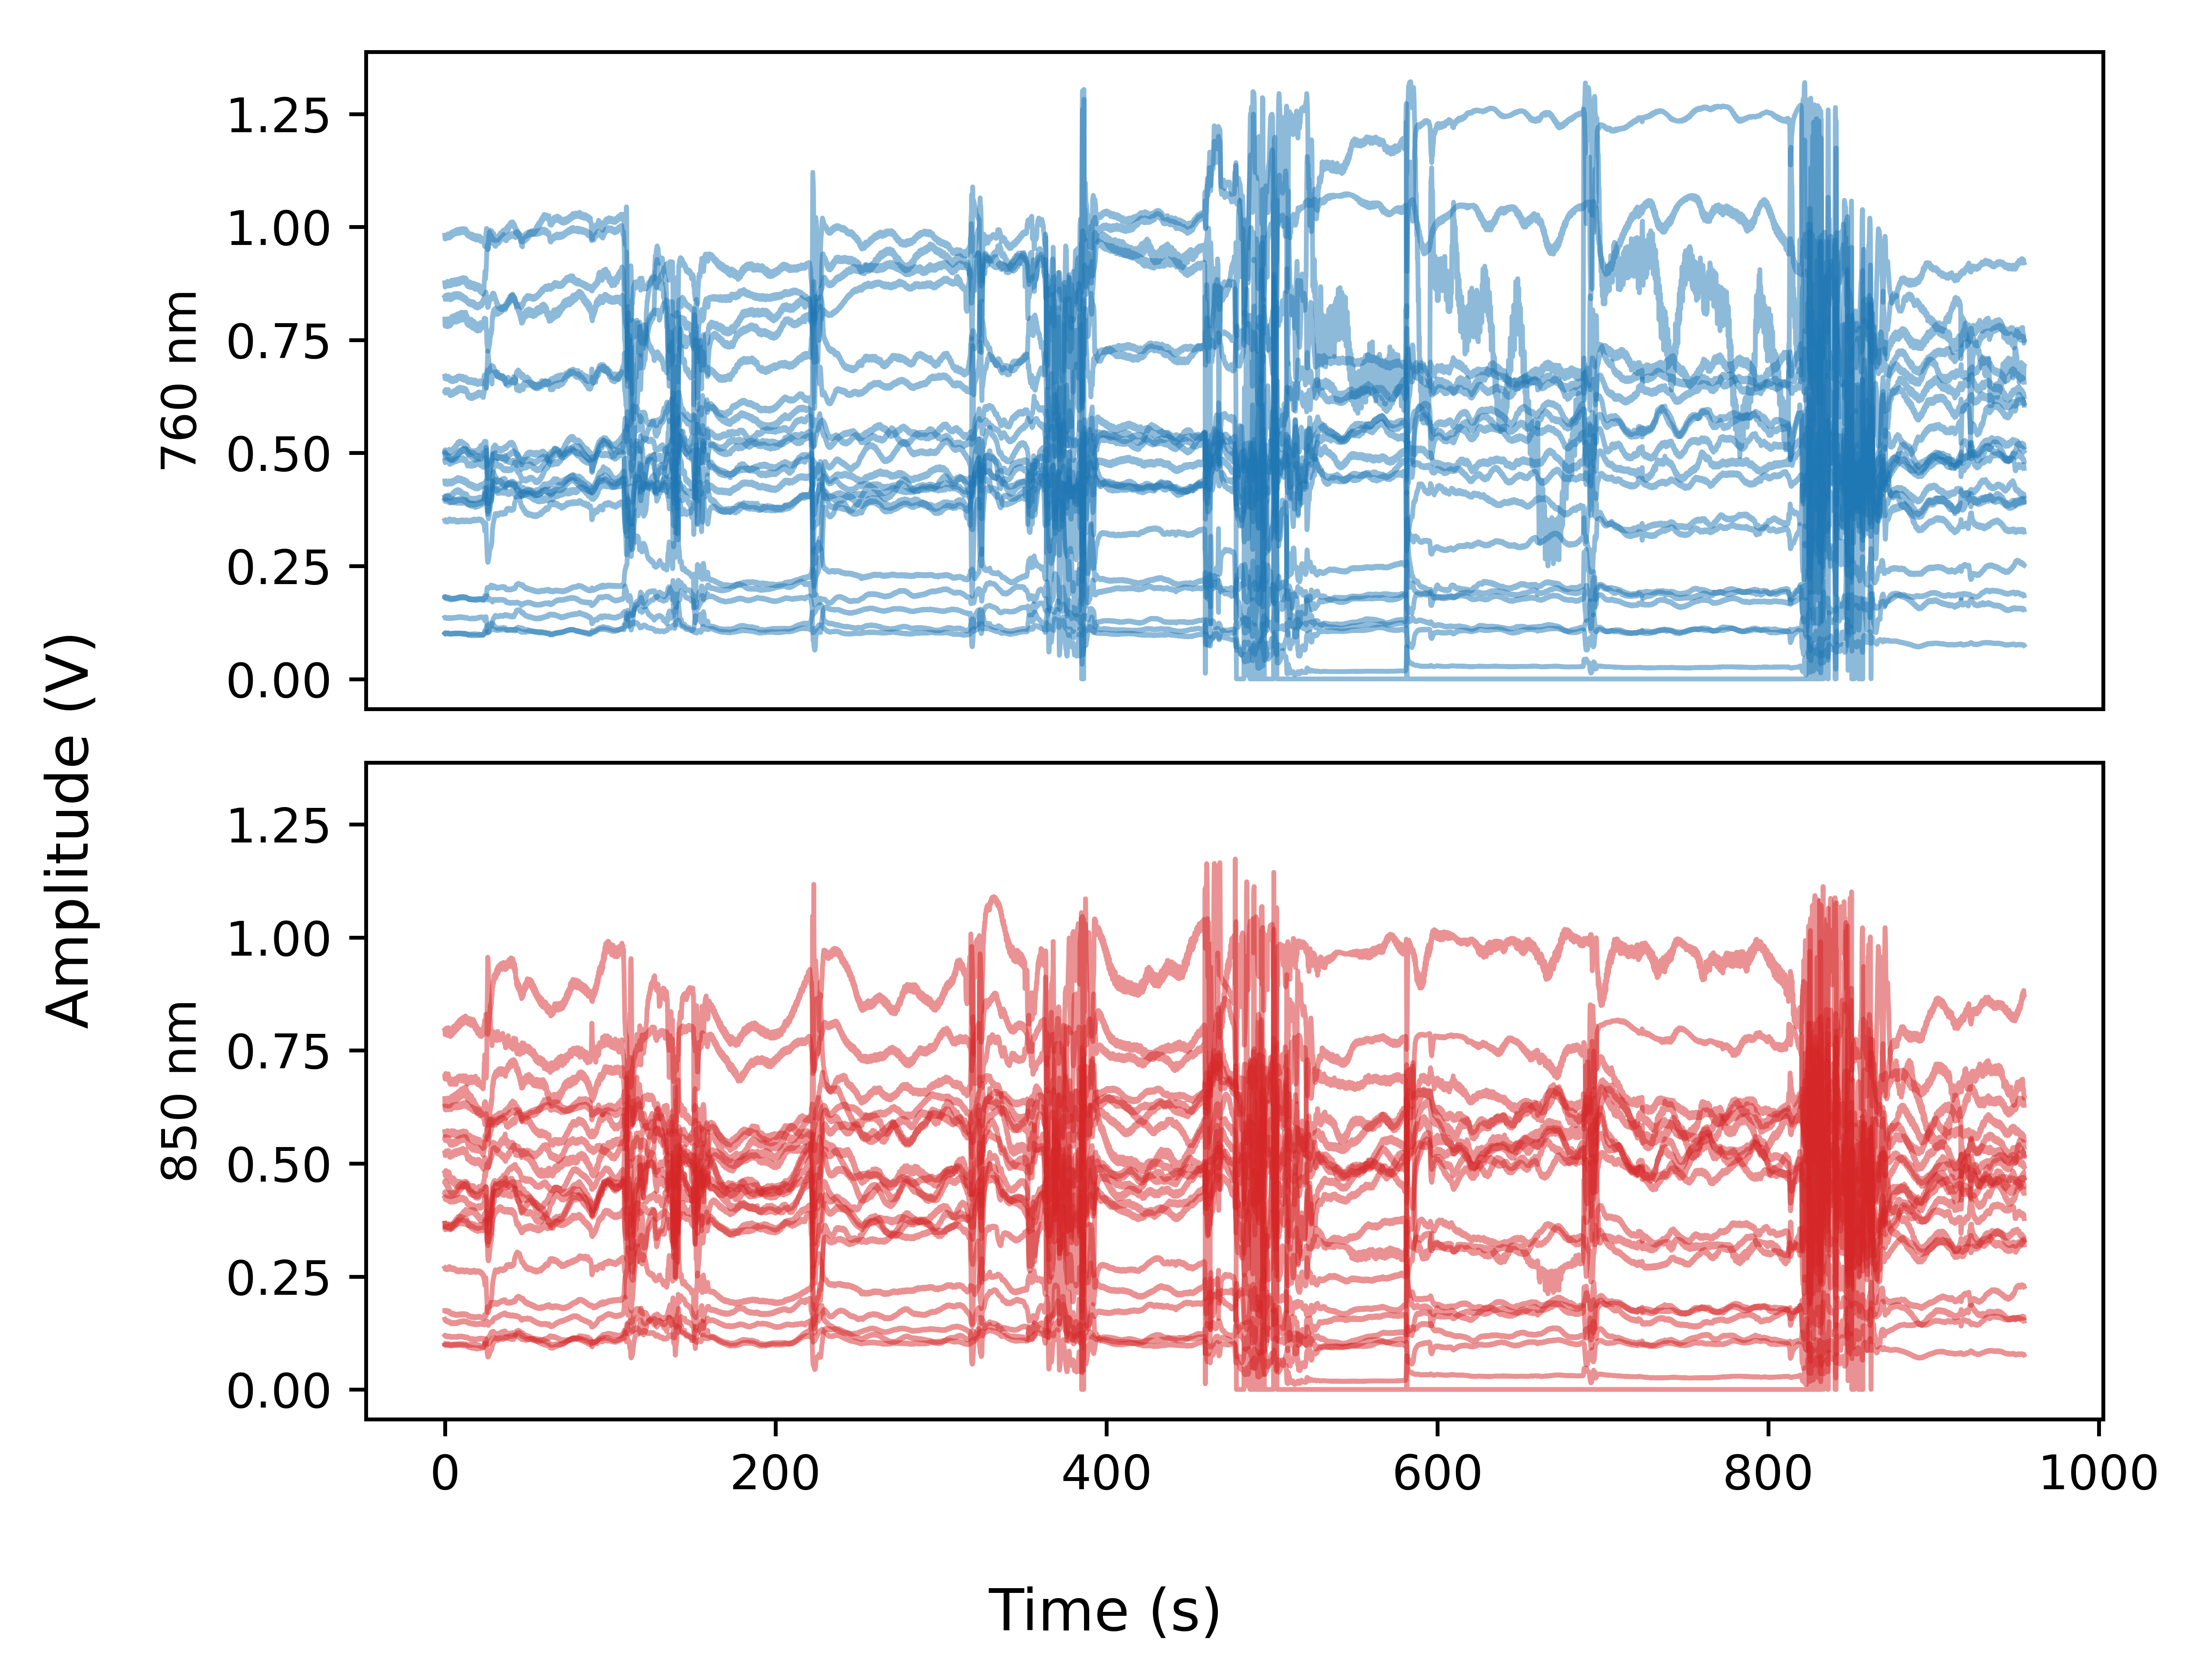
The ugly: sleeping neonate
The ugly: sleeping neonate
Signal quality: after data collection
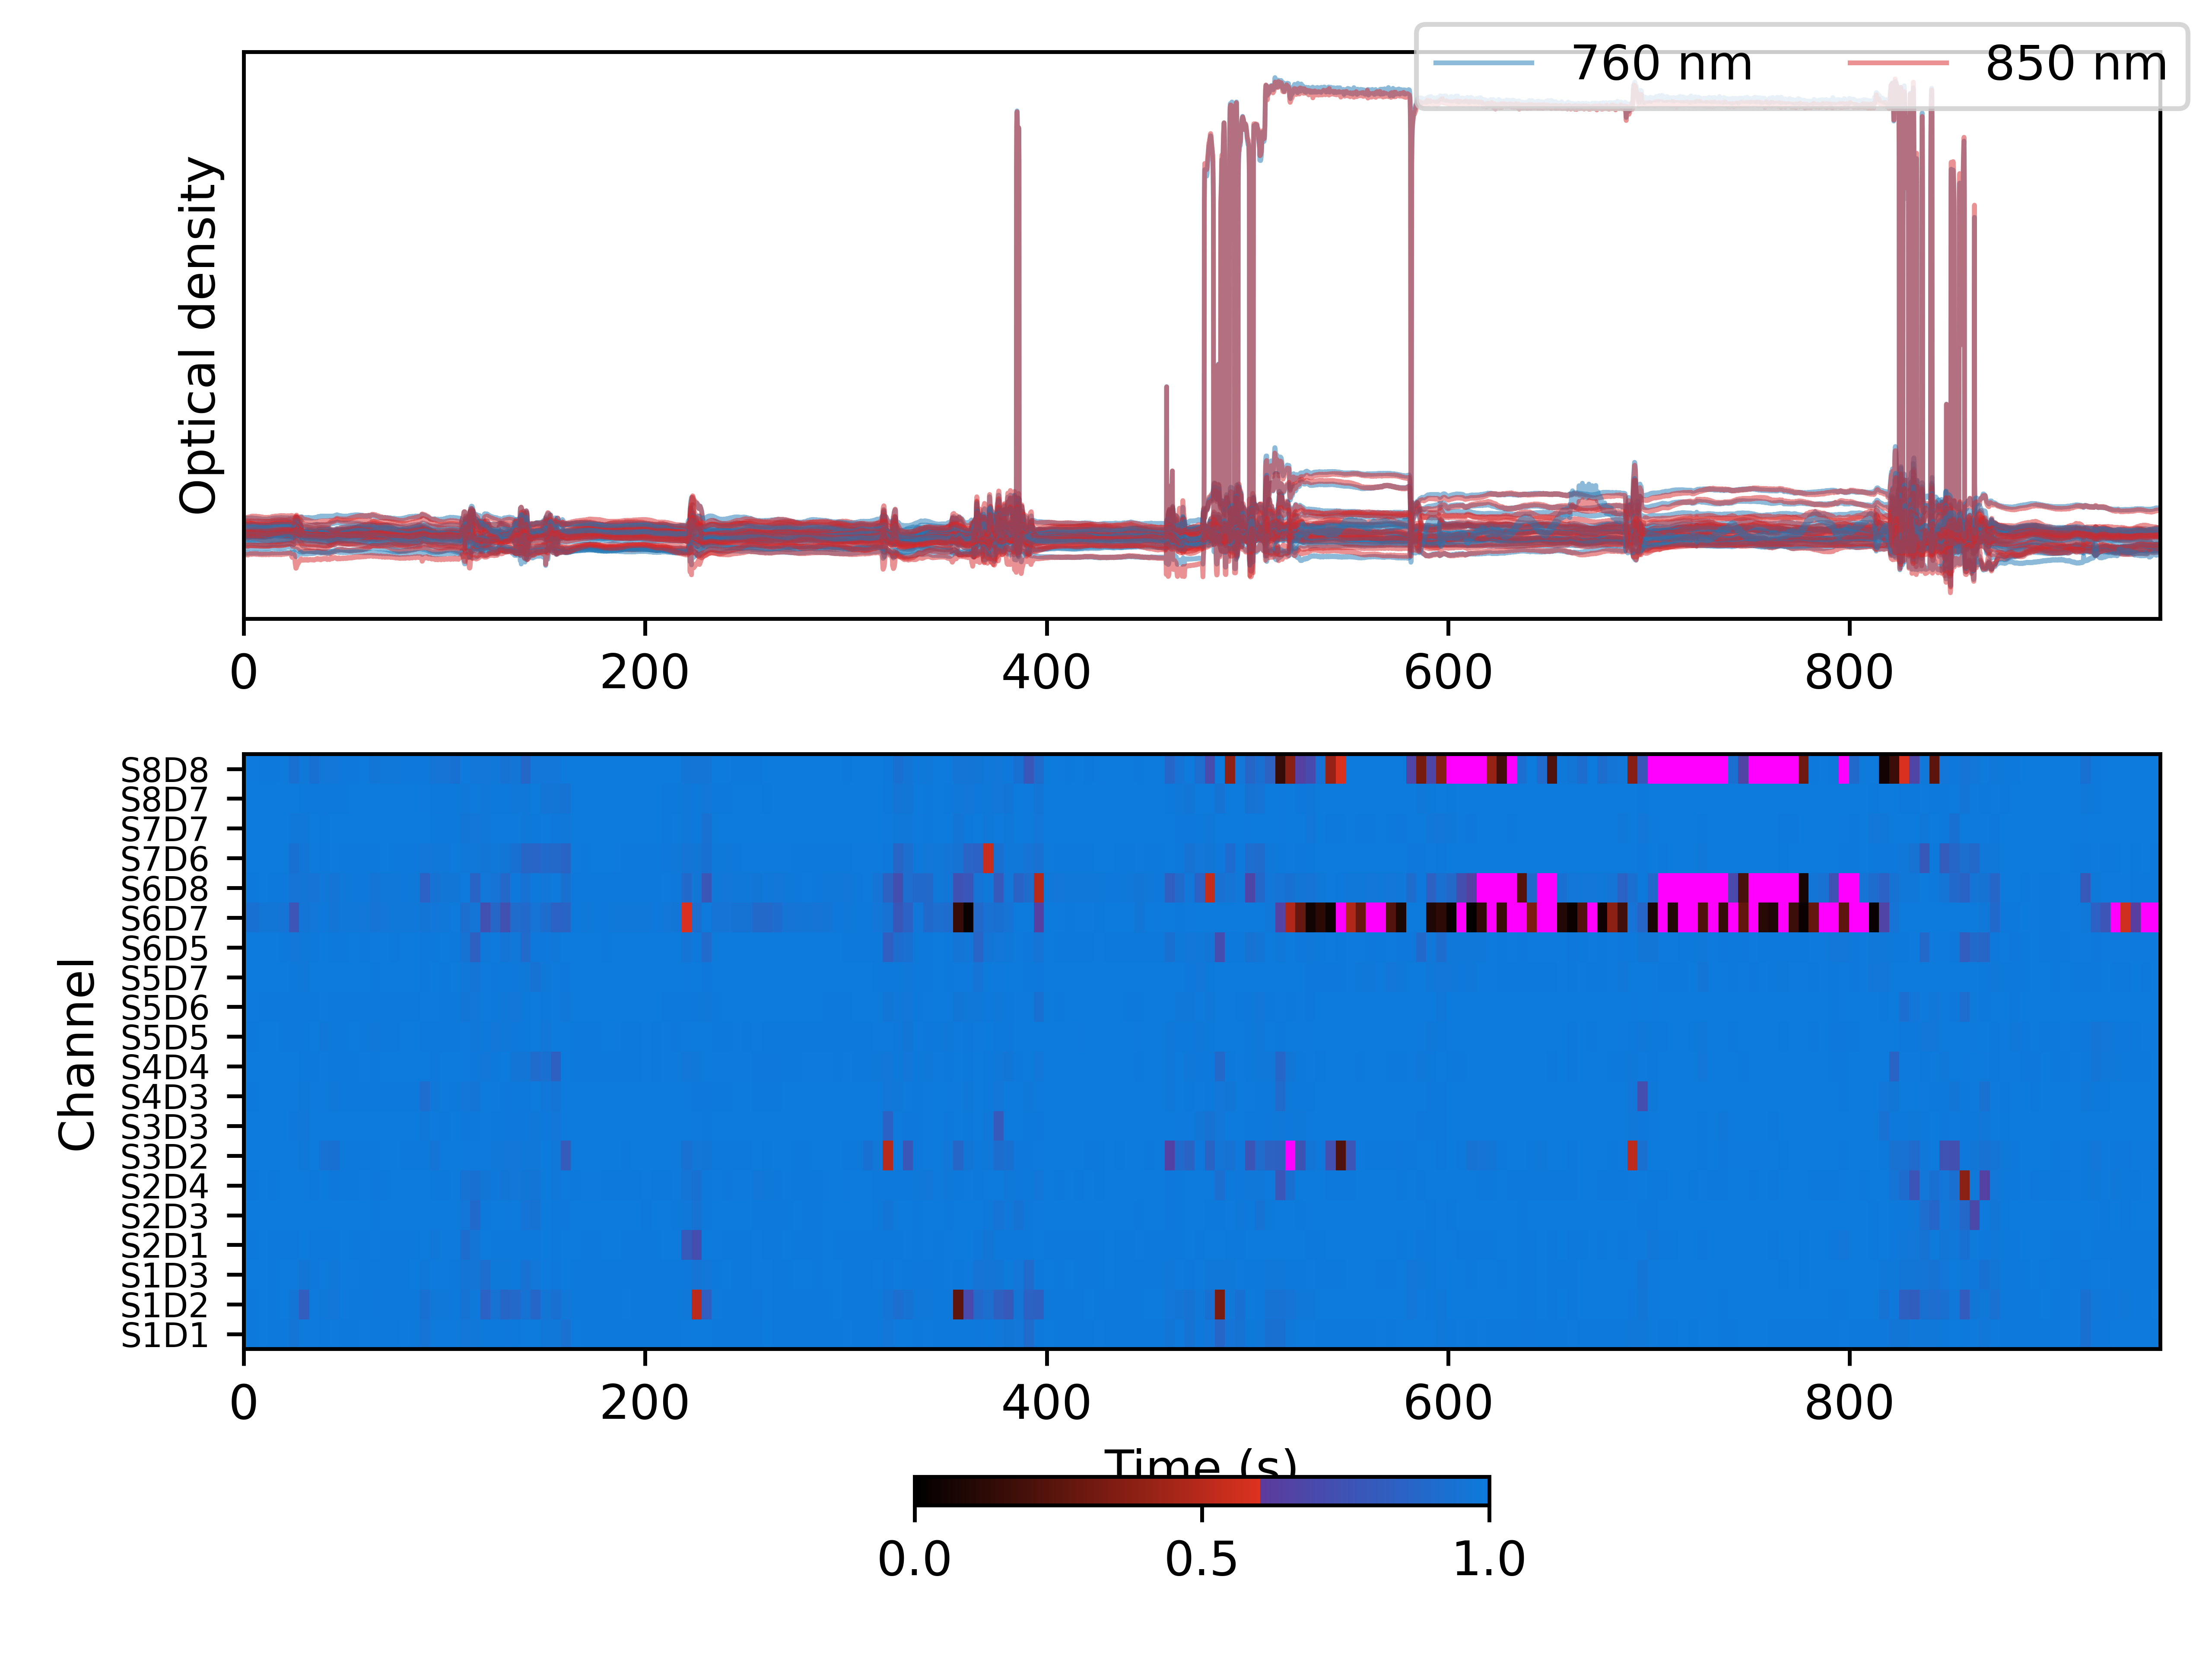
Signal quality: after data collection
Signal quality: choosing thresholds
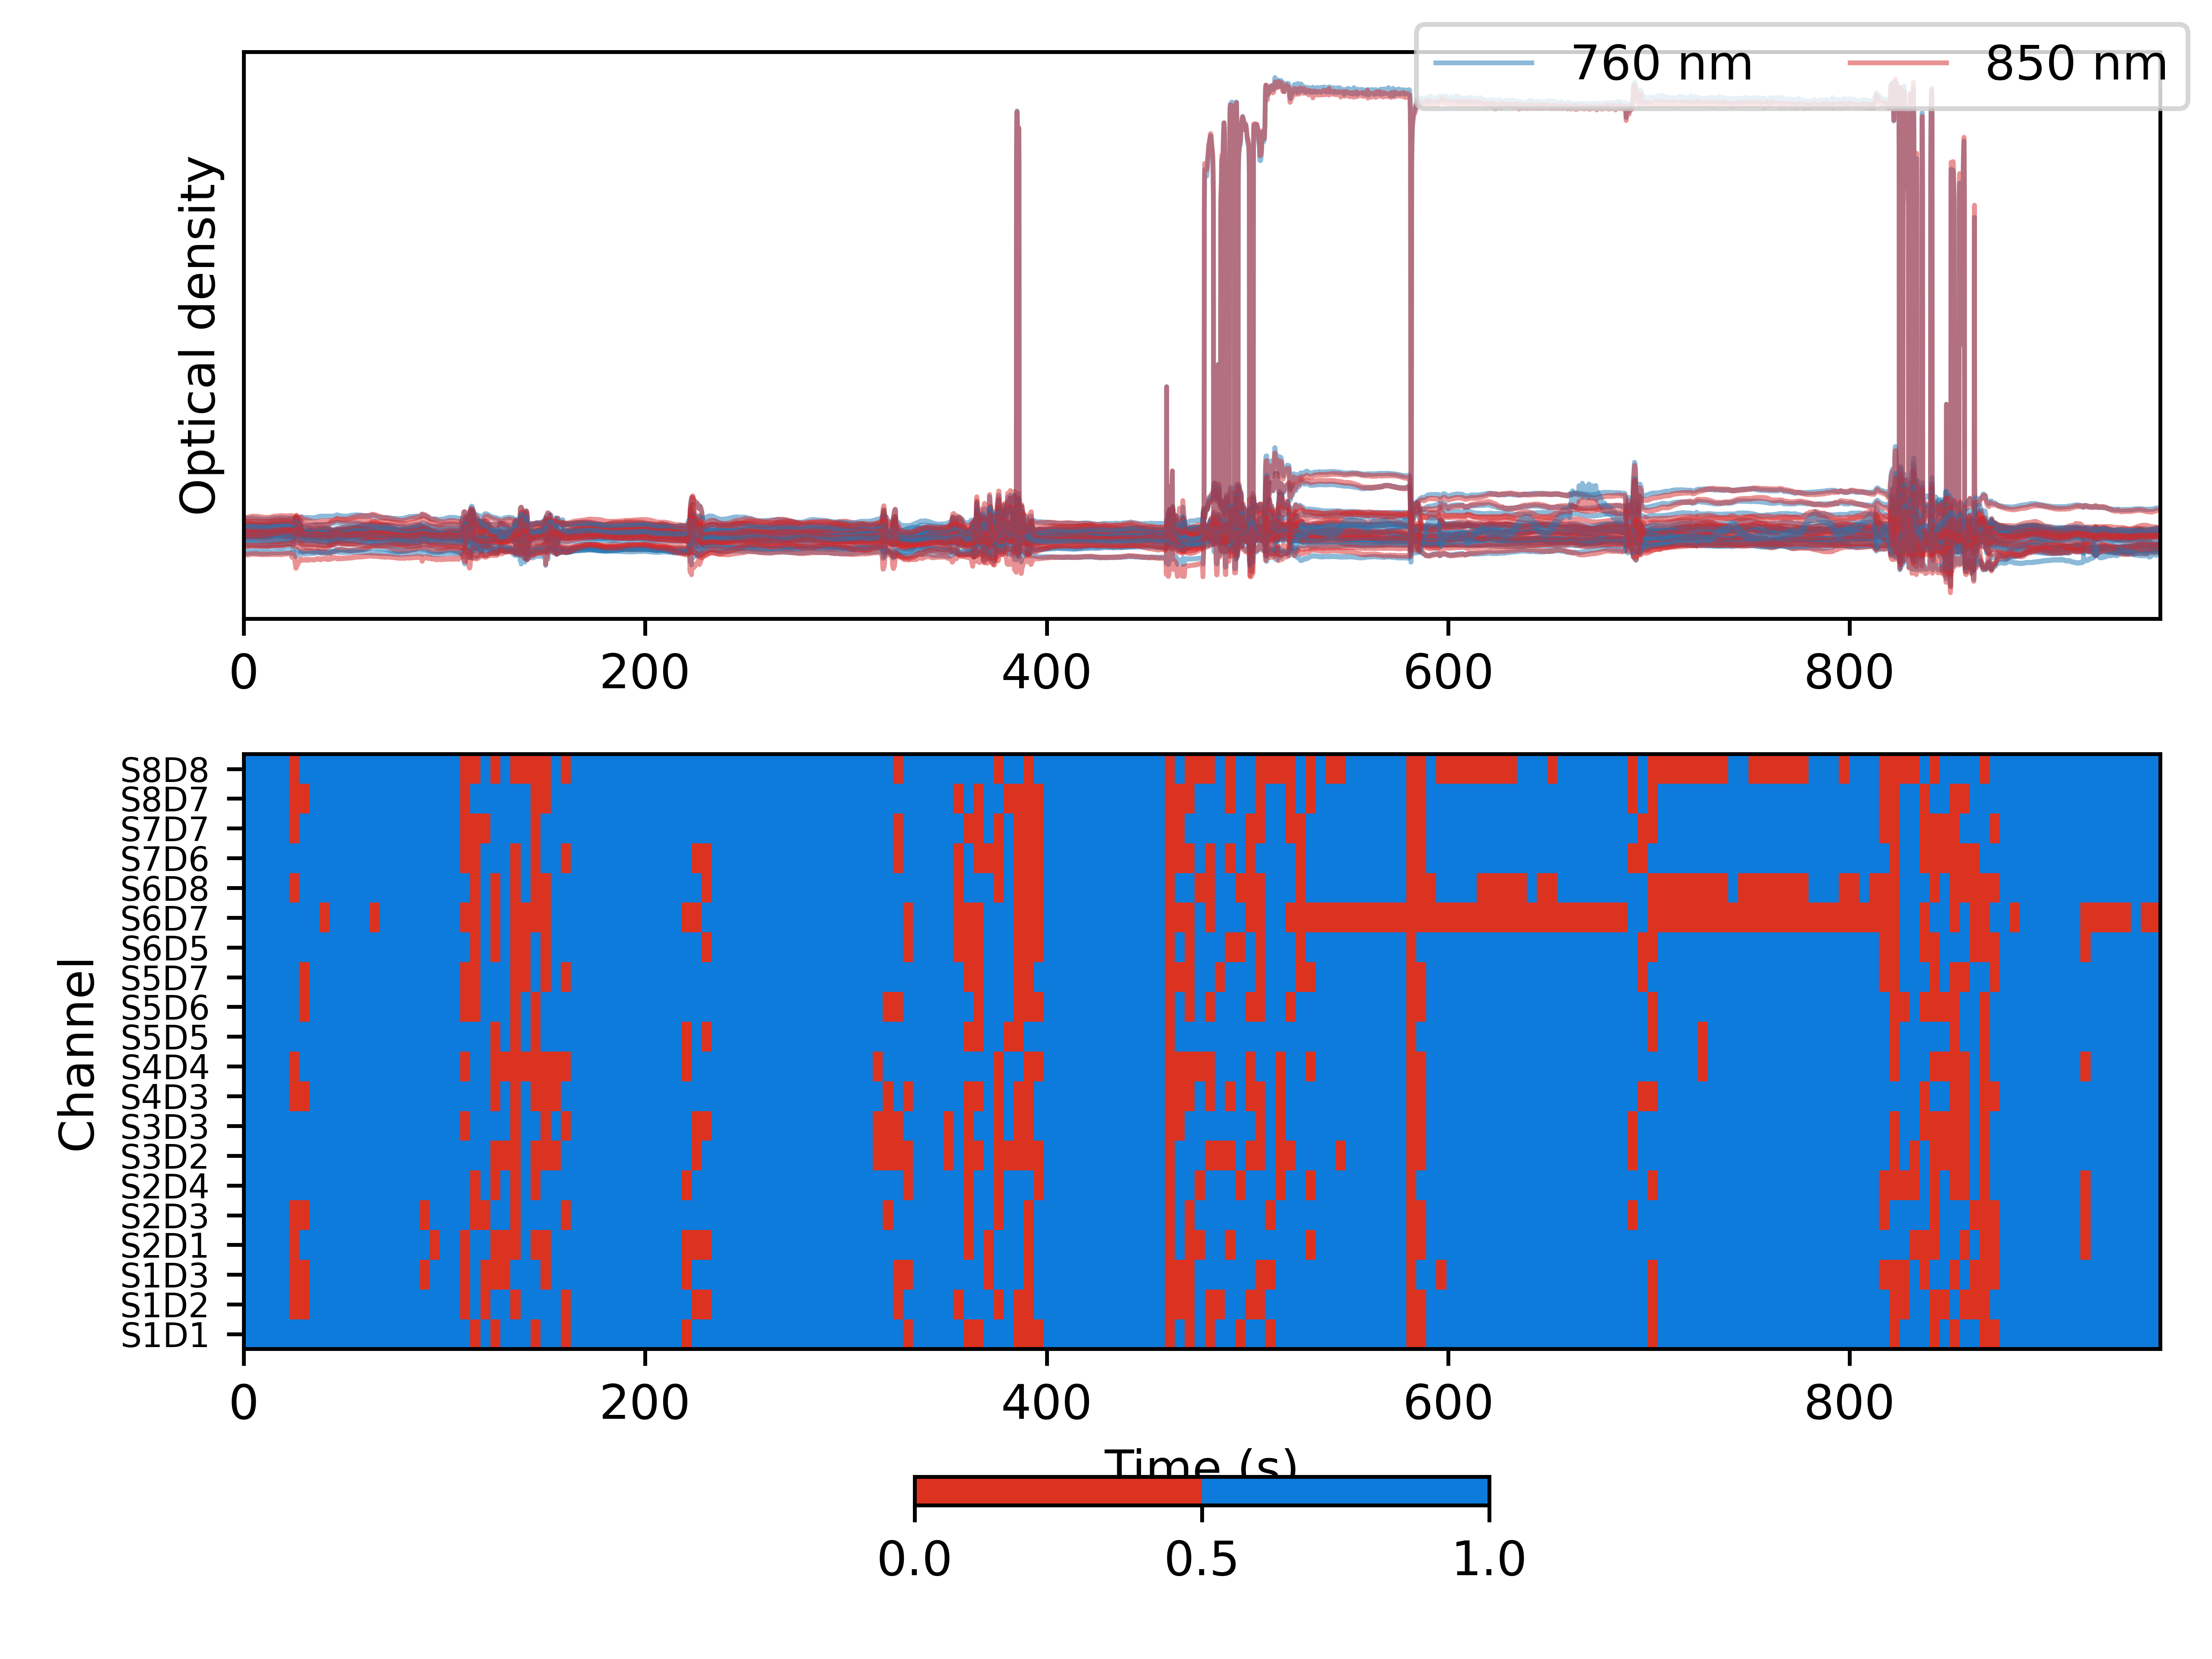
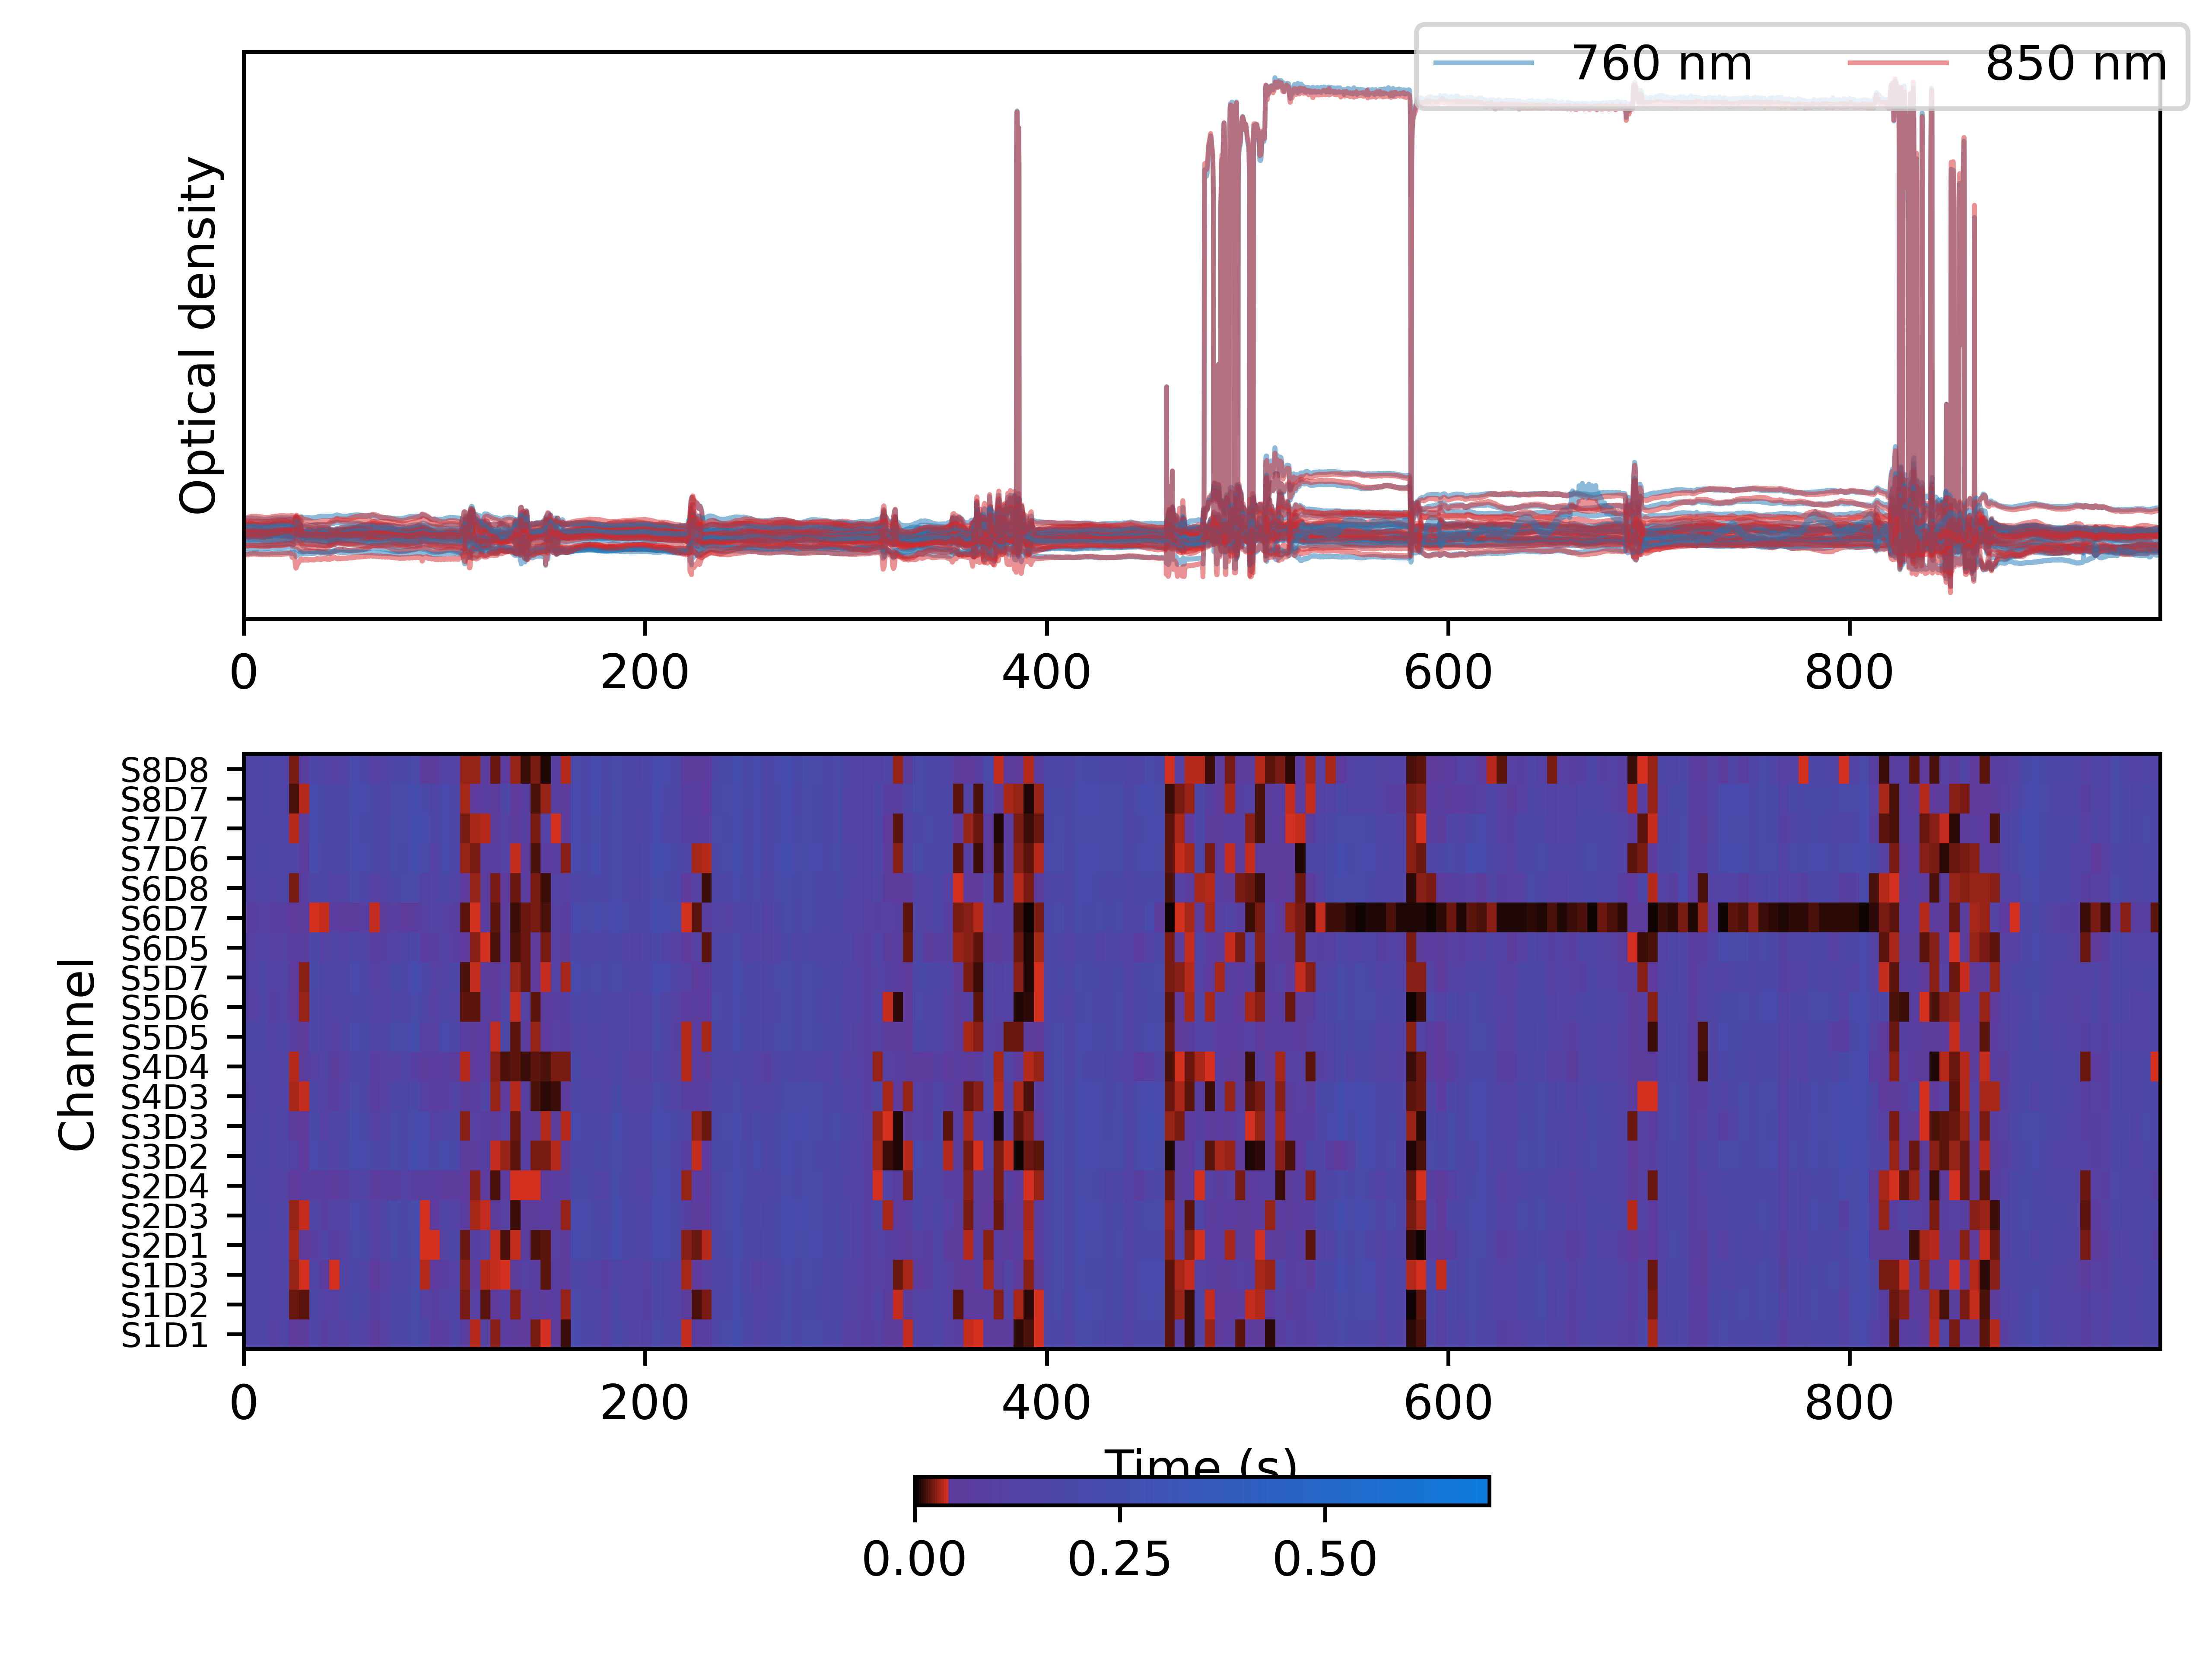
Signal quality: channel pruning
Signal quality: channel pruning
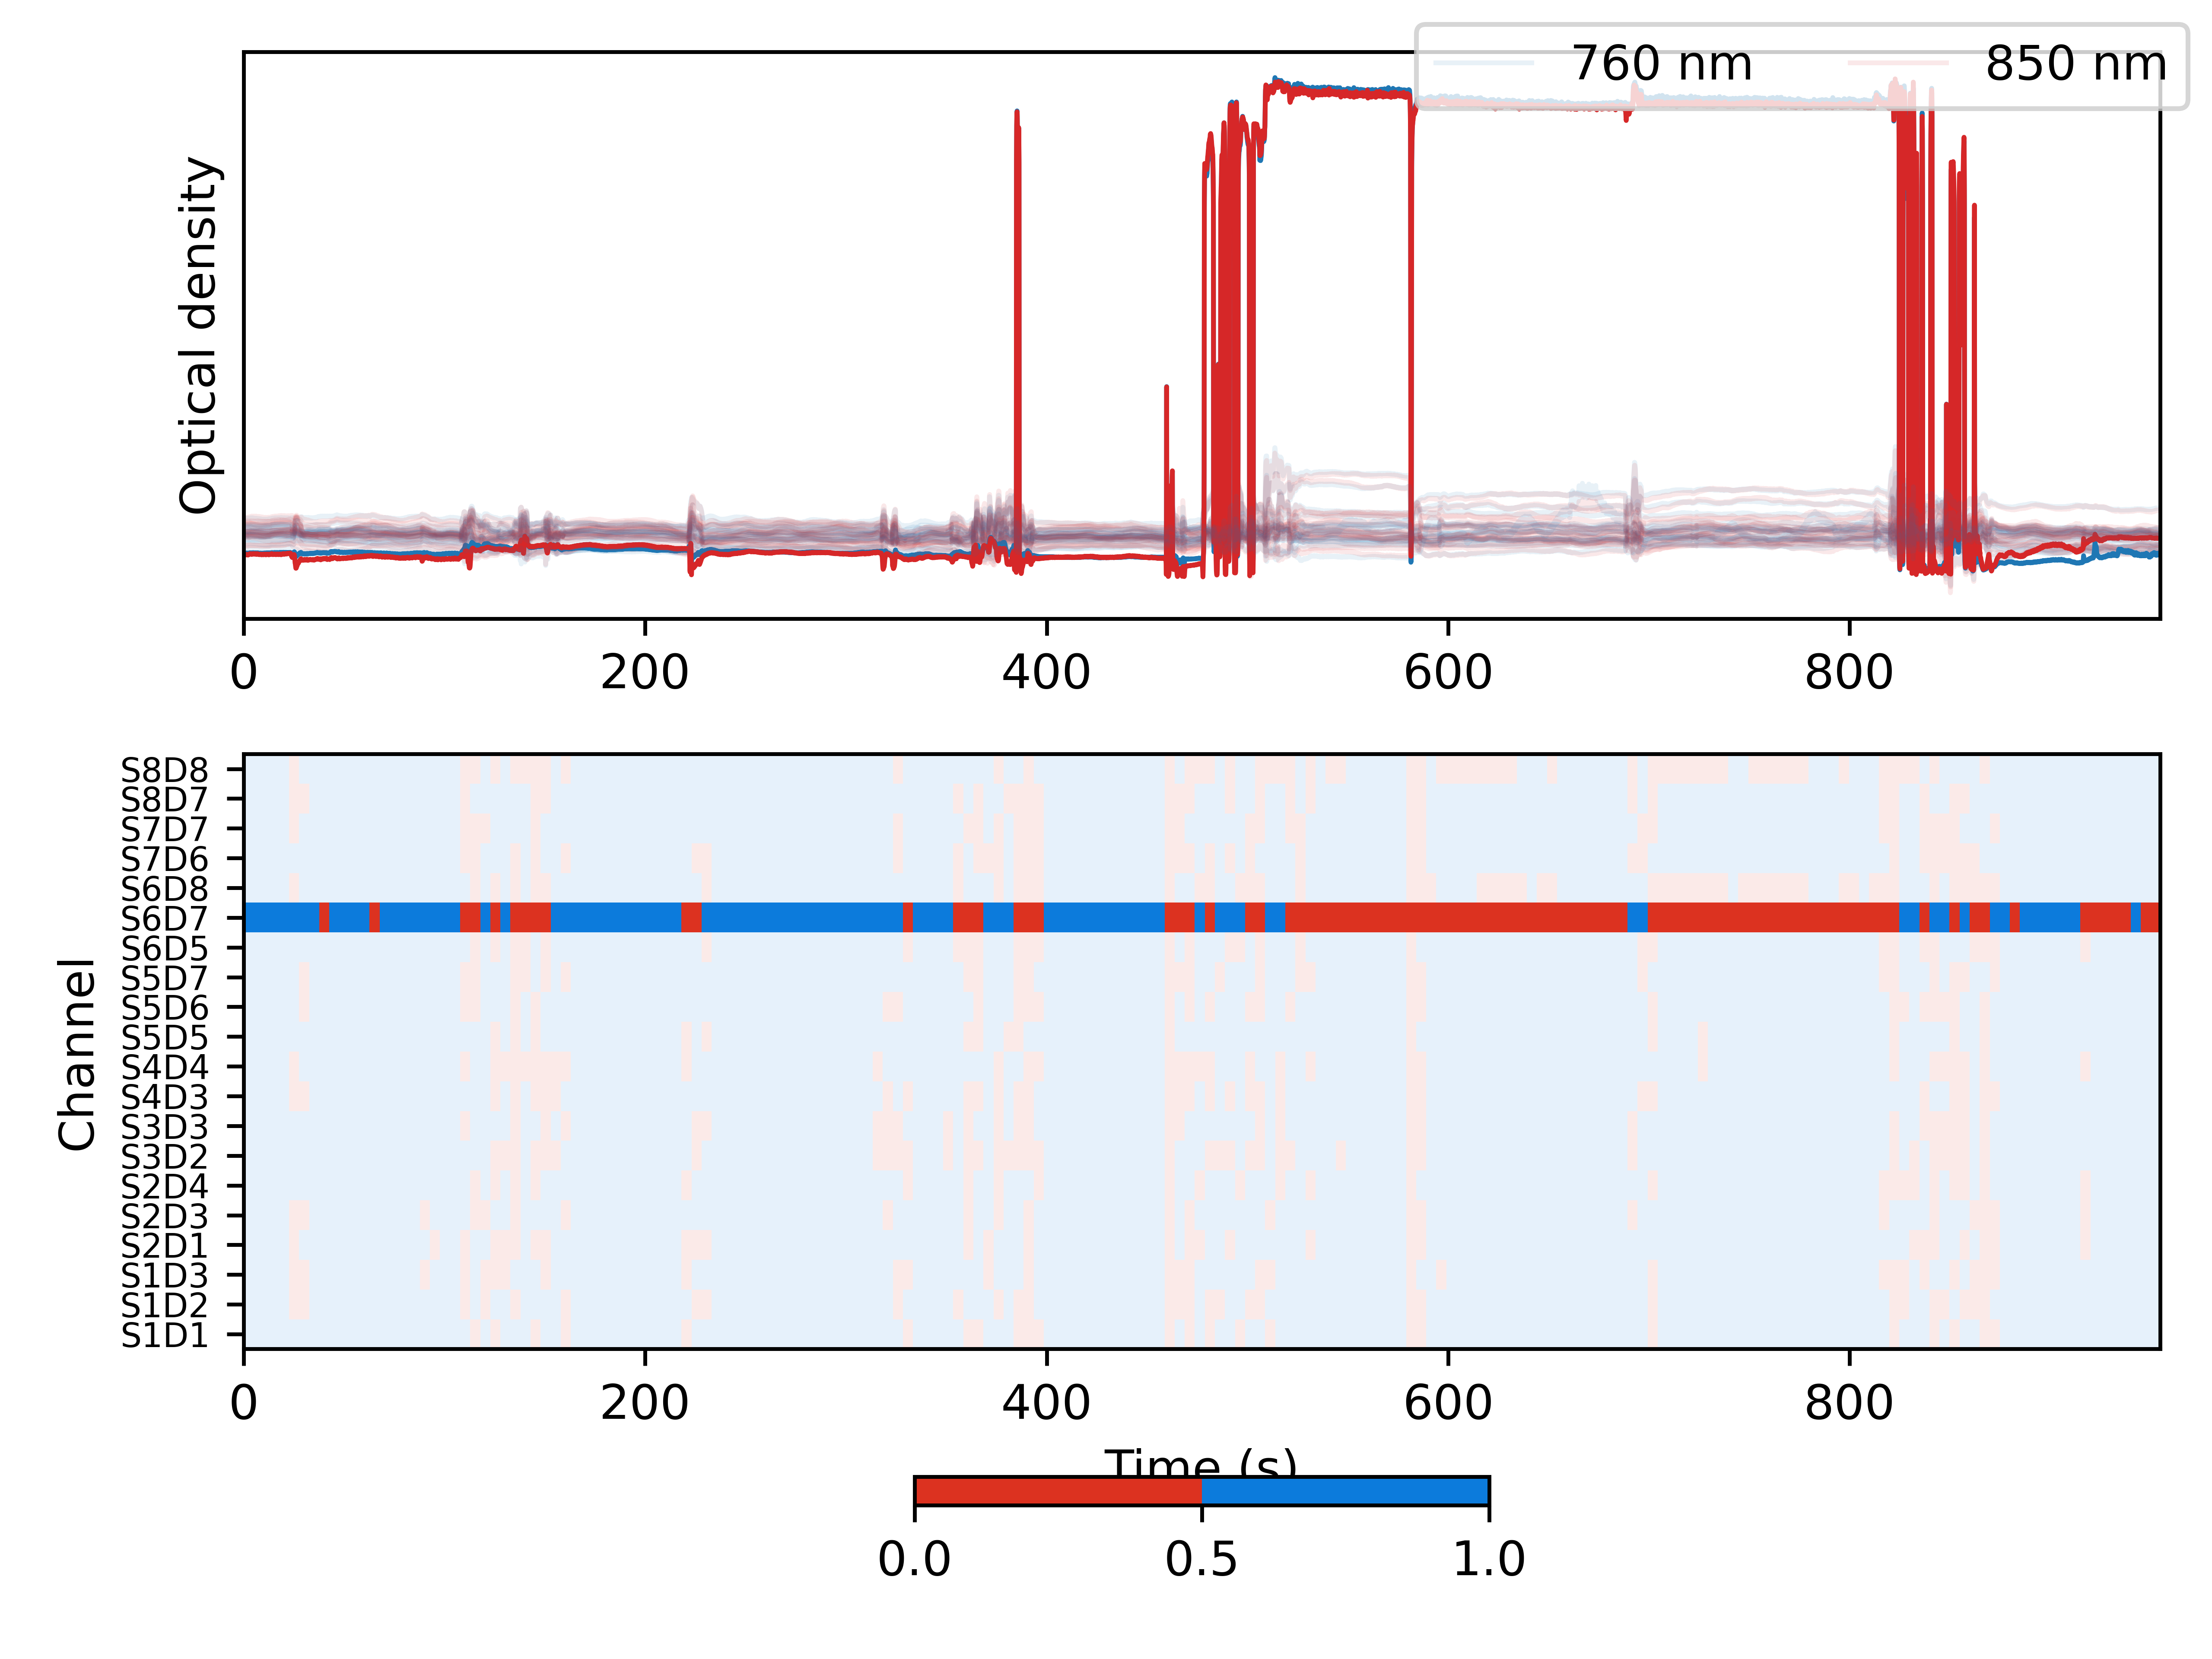
Signal quality: channel pruning
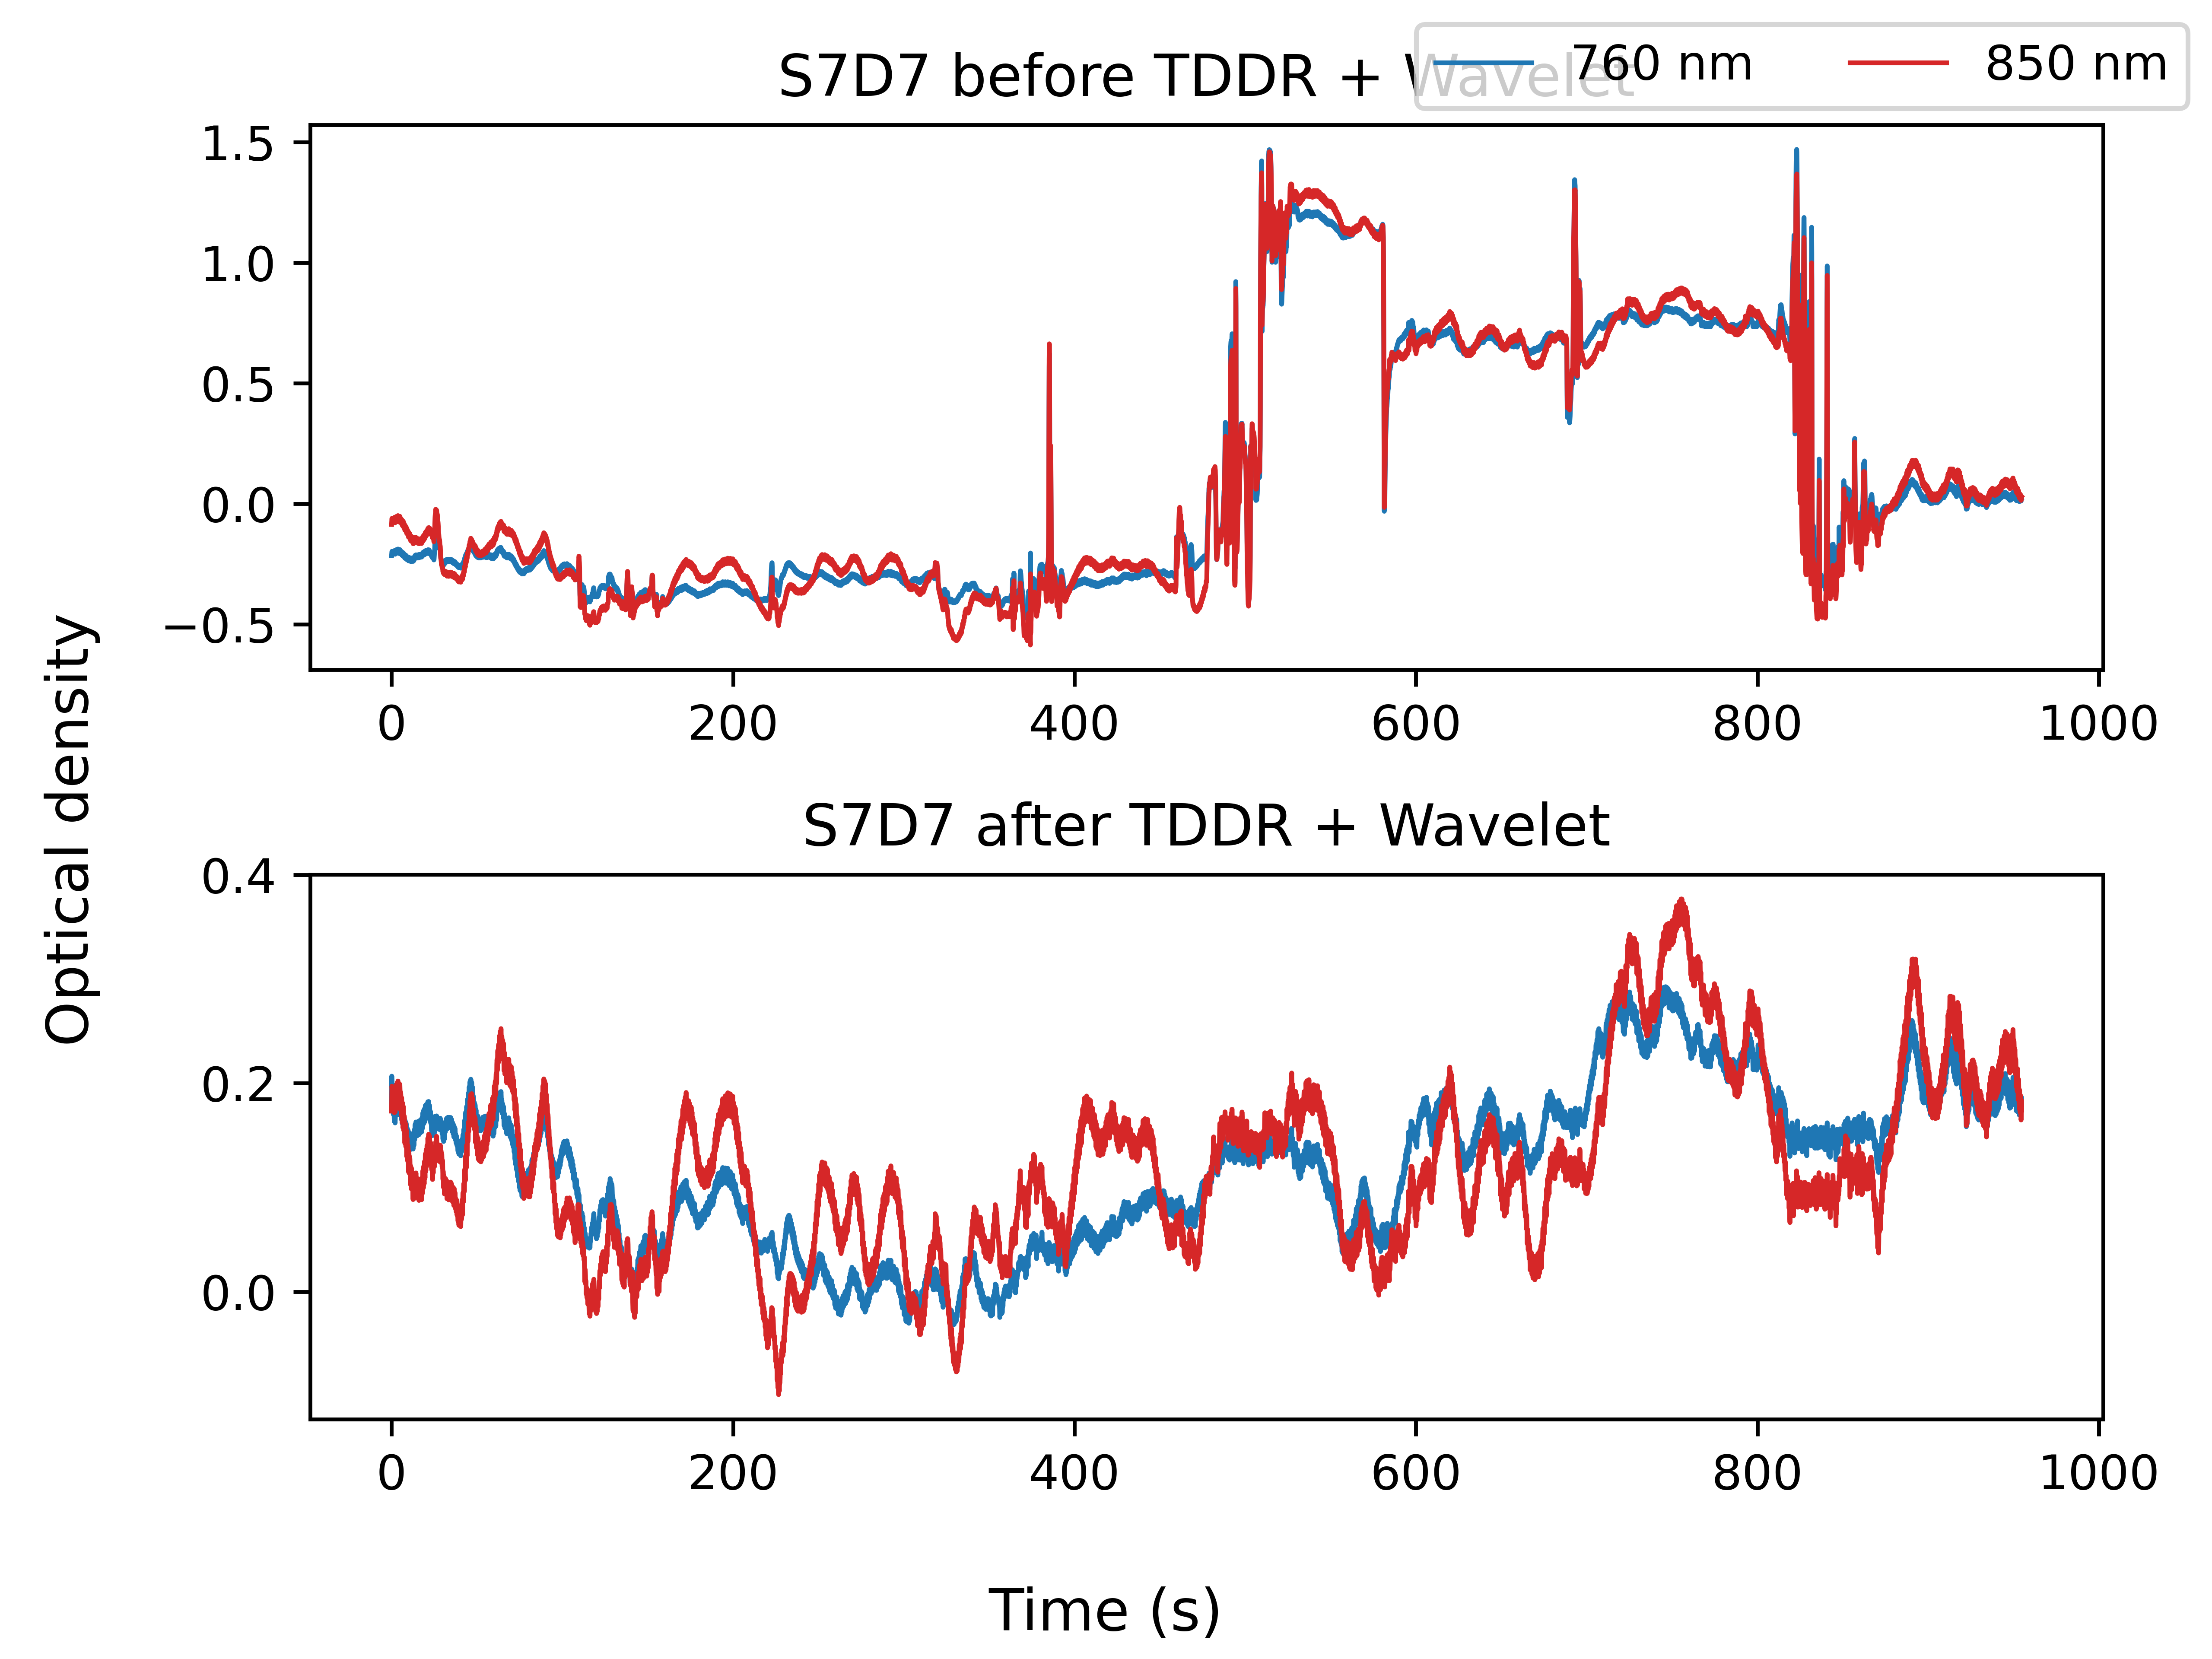
Motion arctifact attenuation
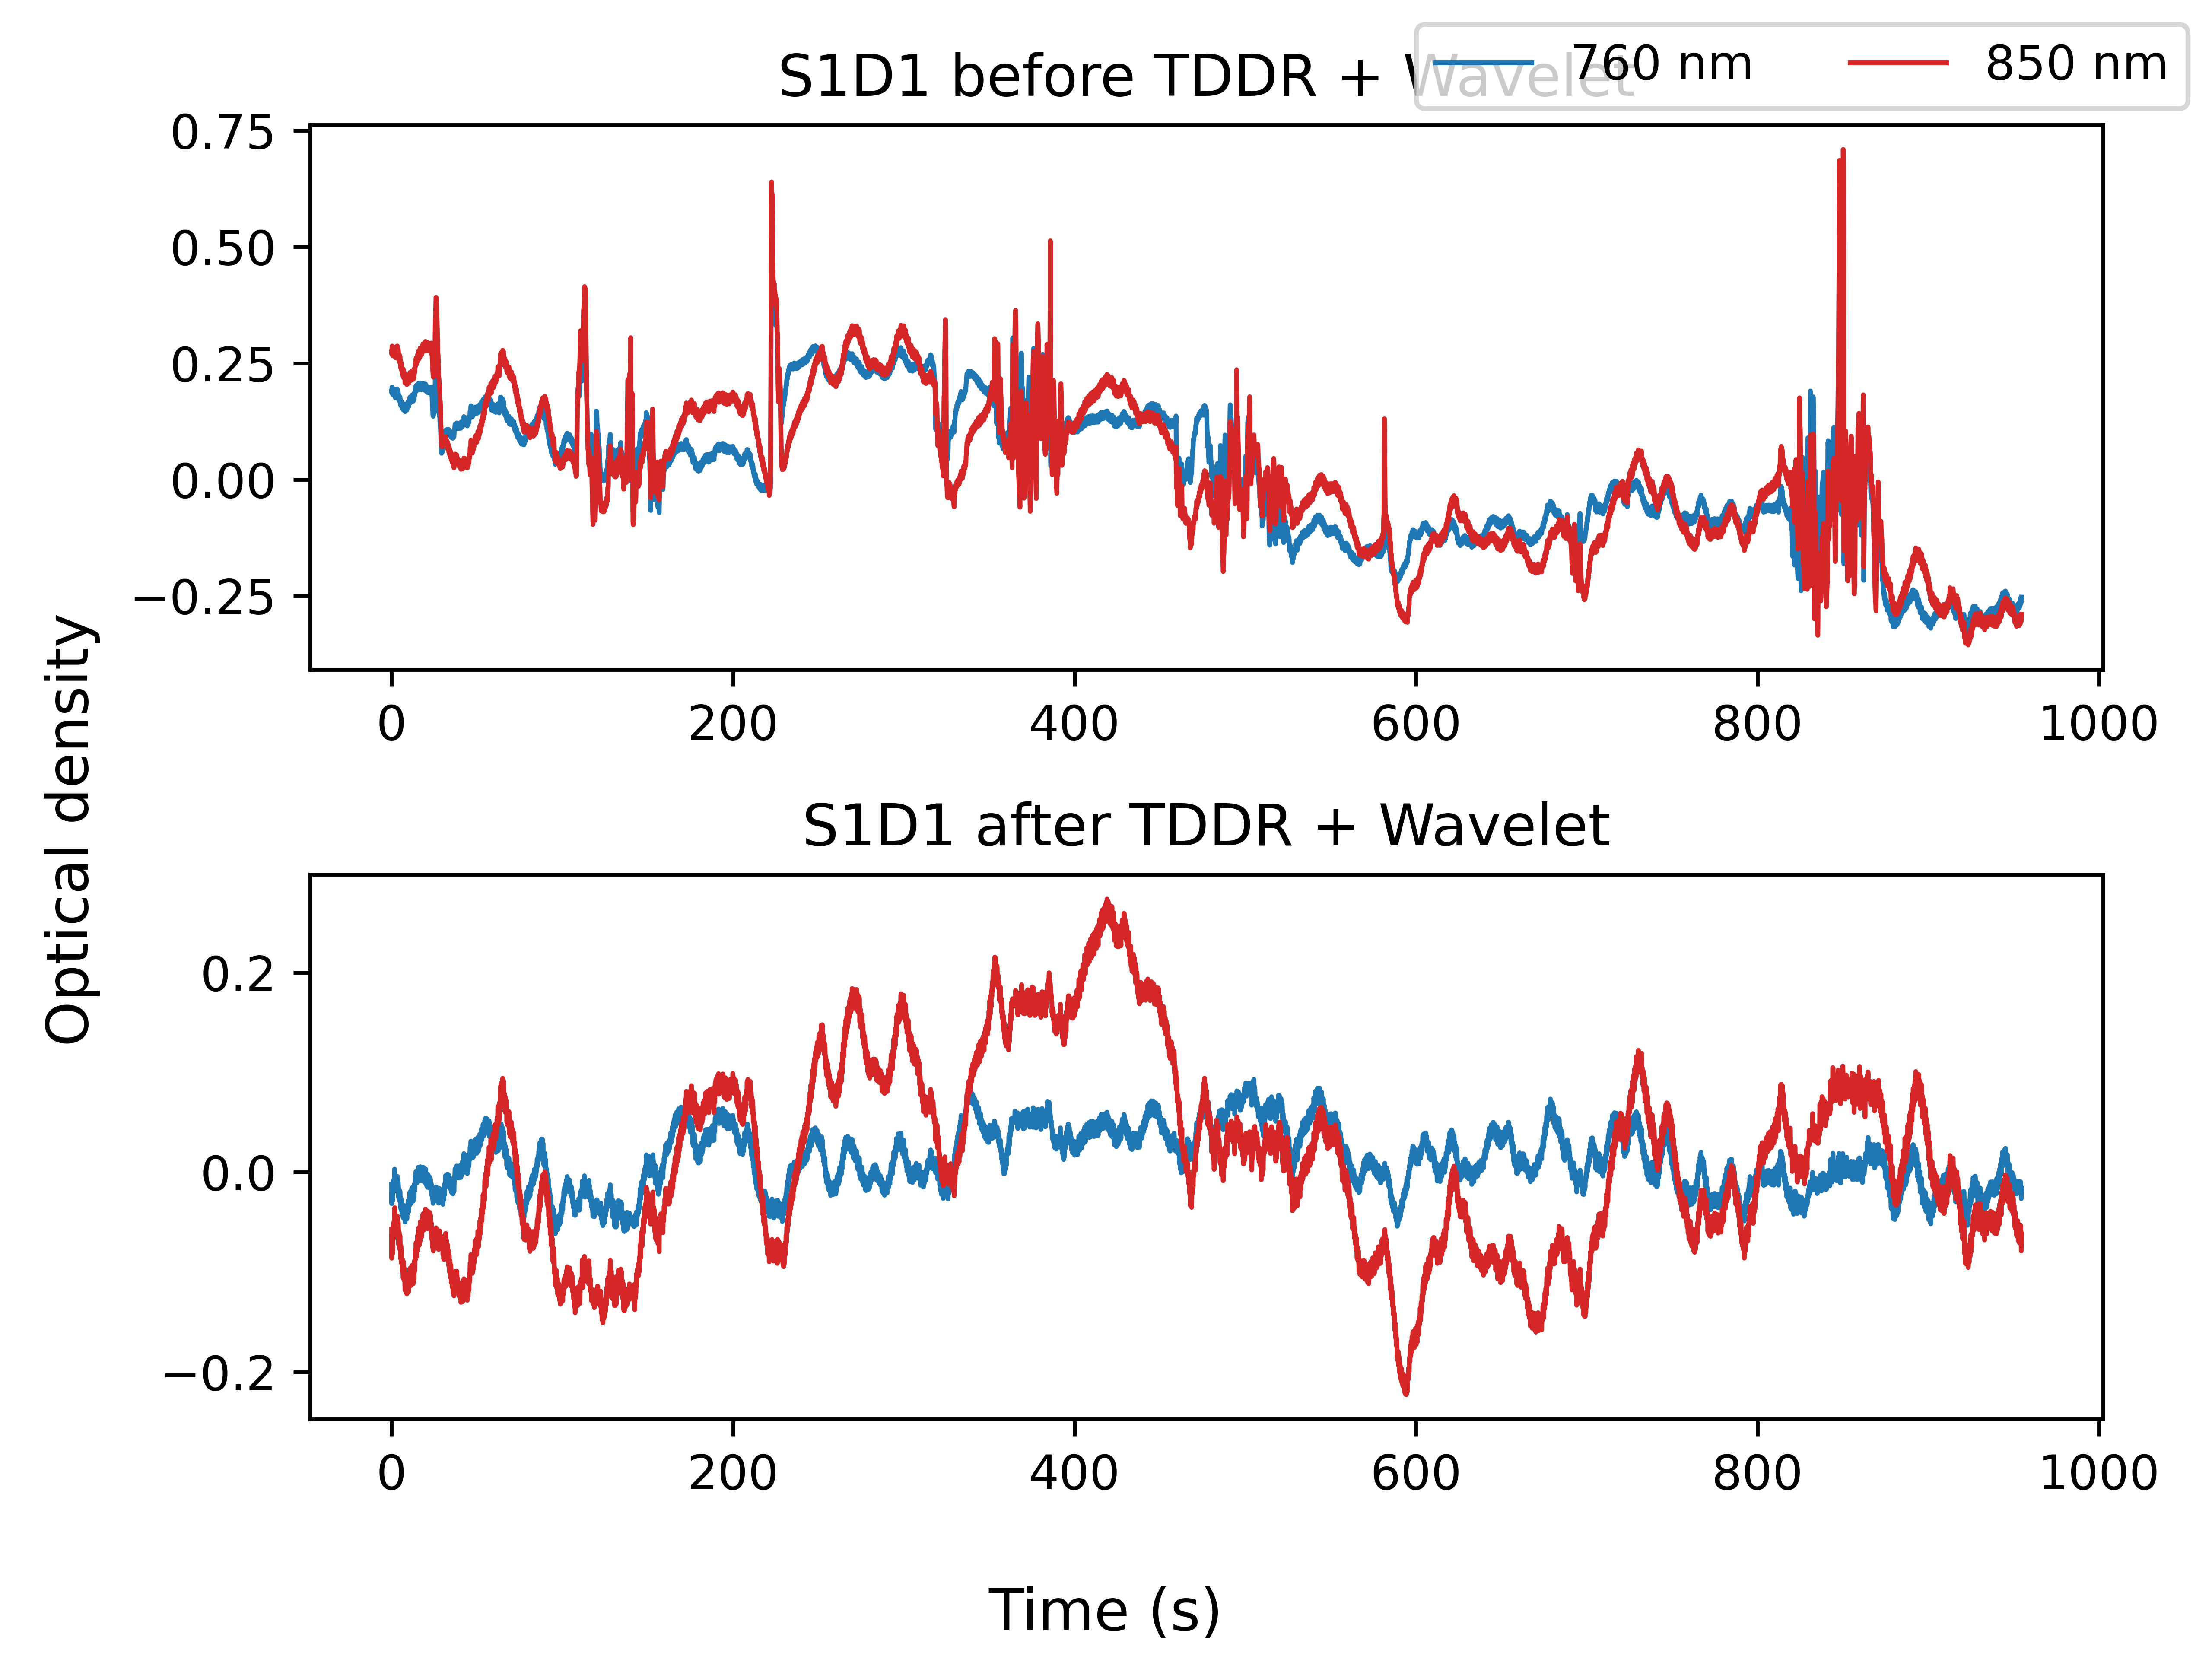
Motion arctifact attenuation
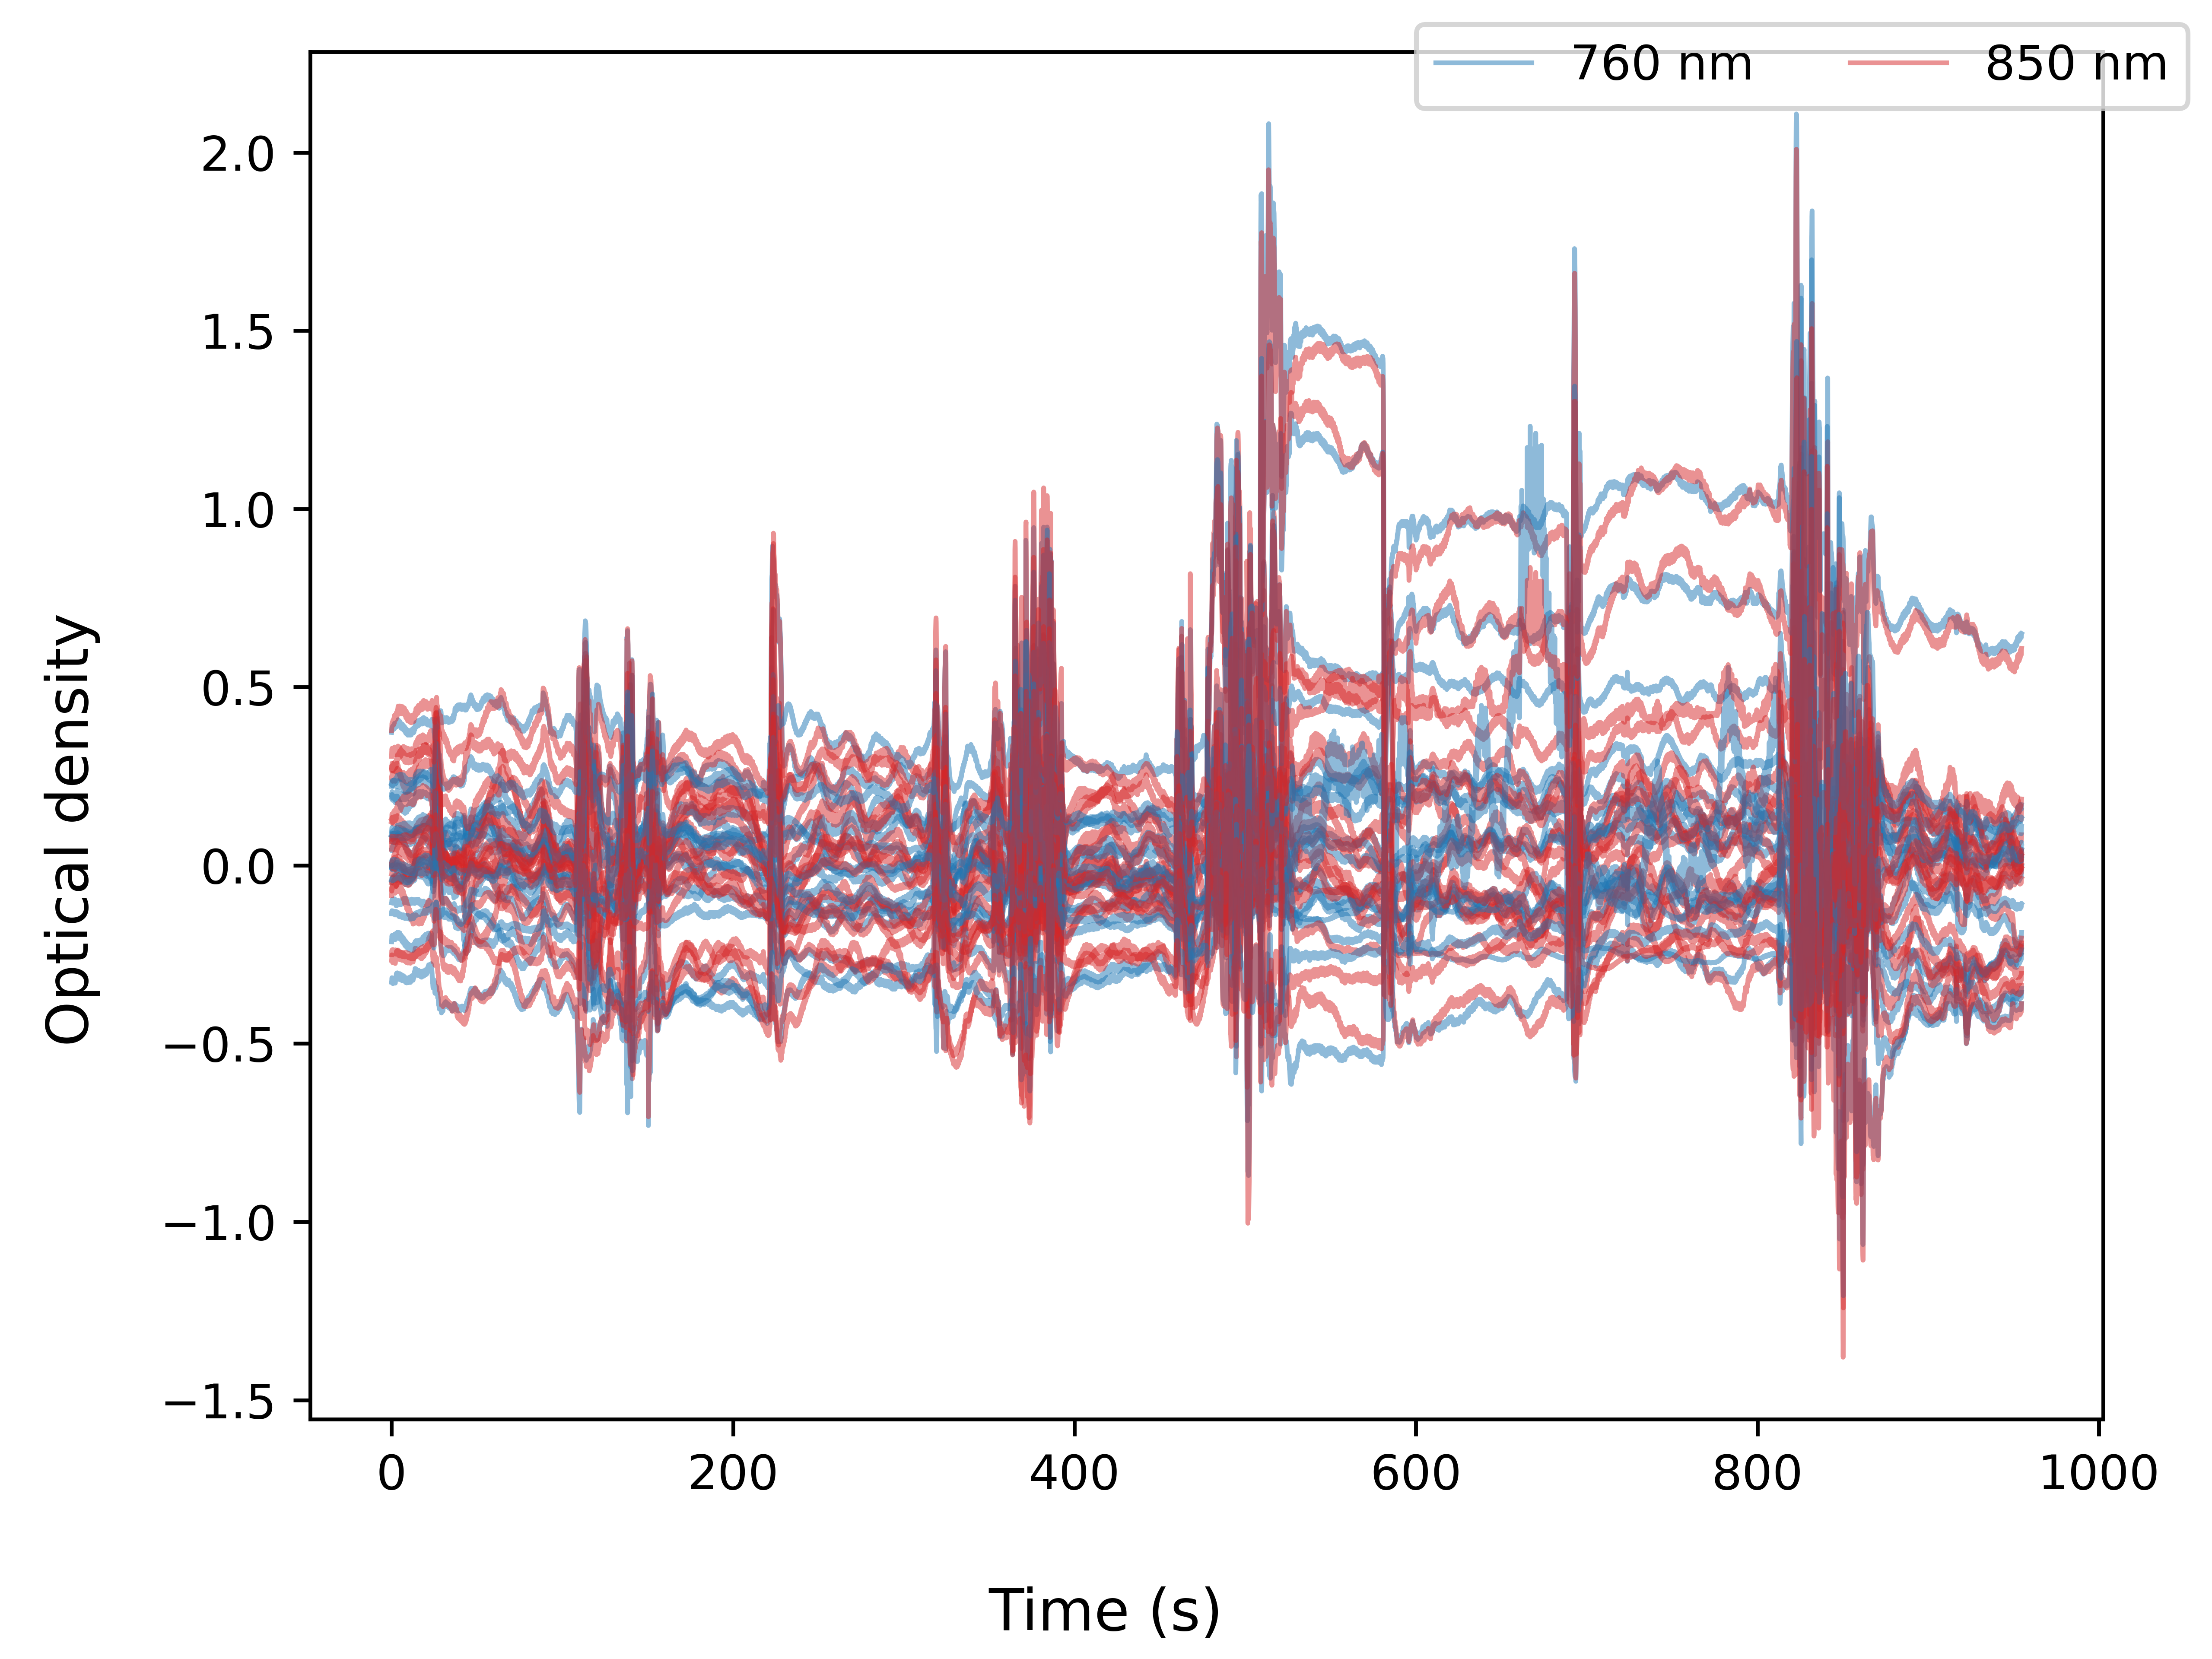
Concentration of HbO and HbR
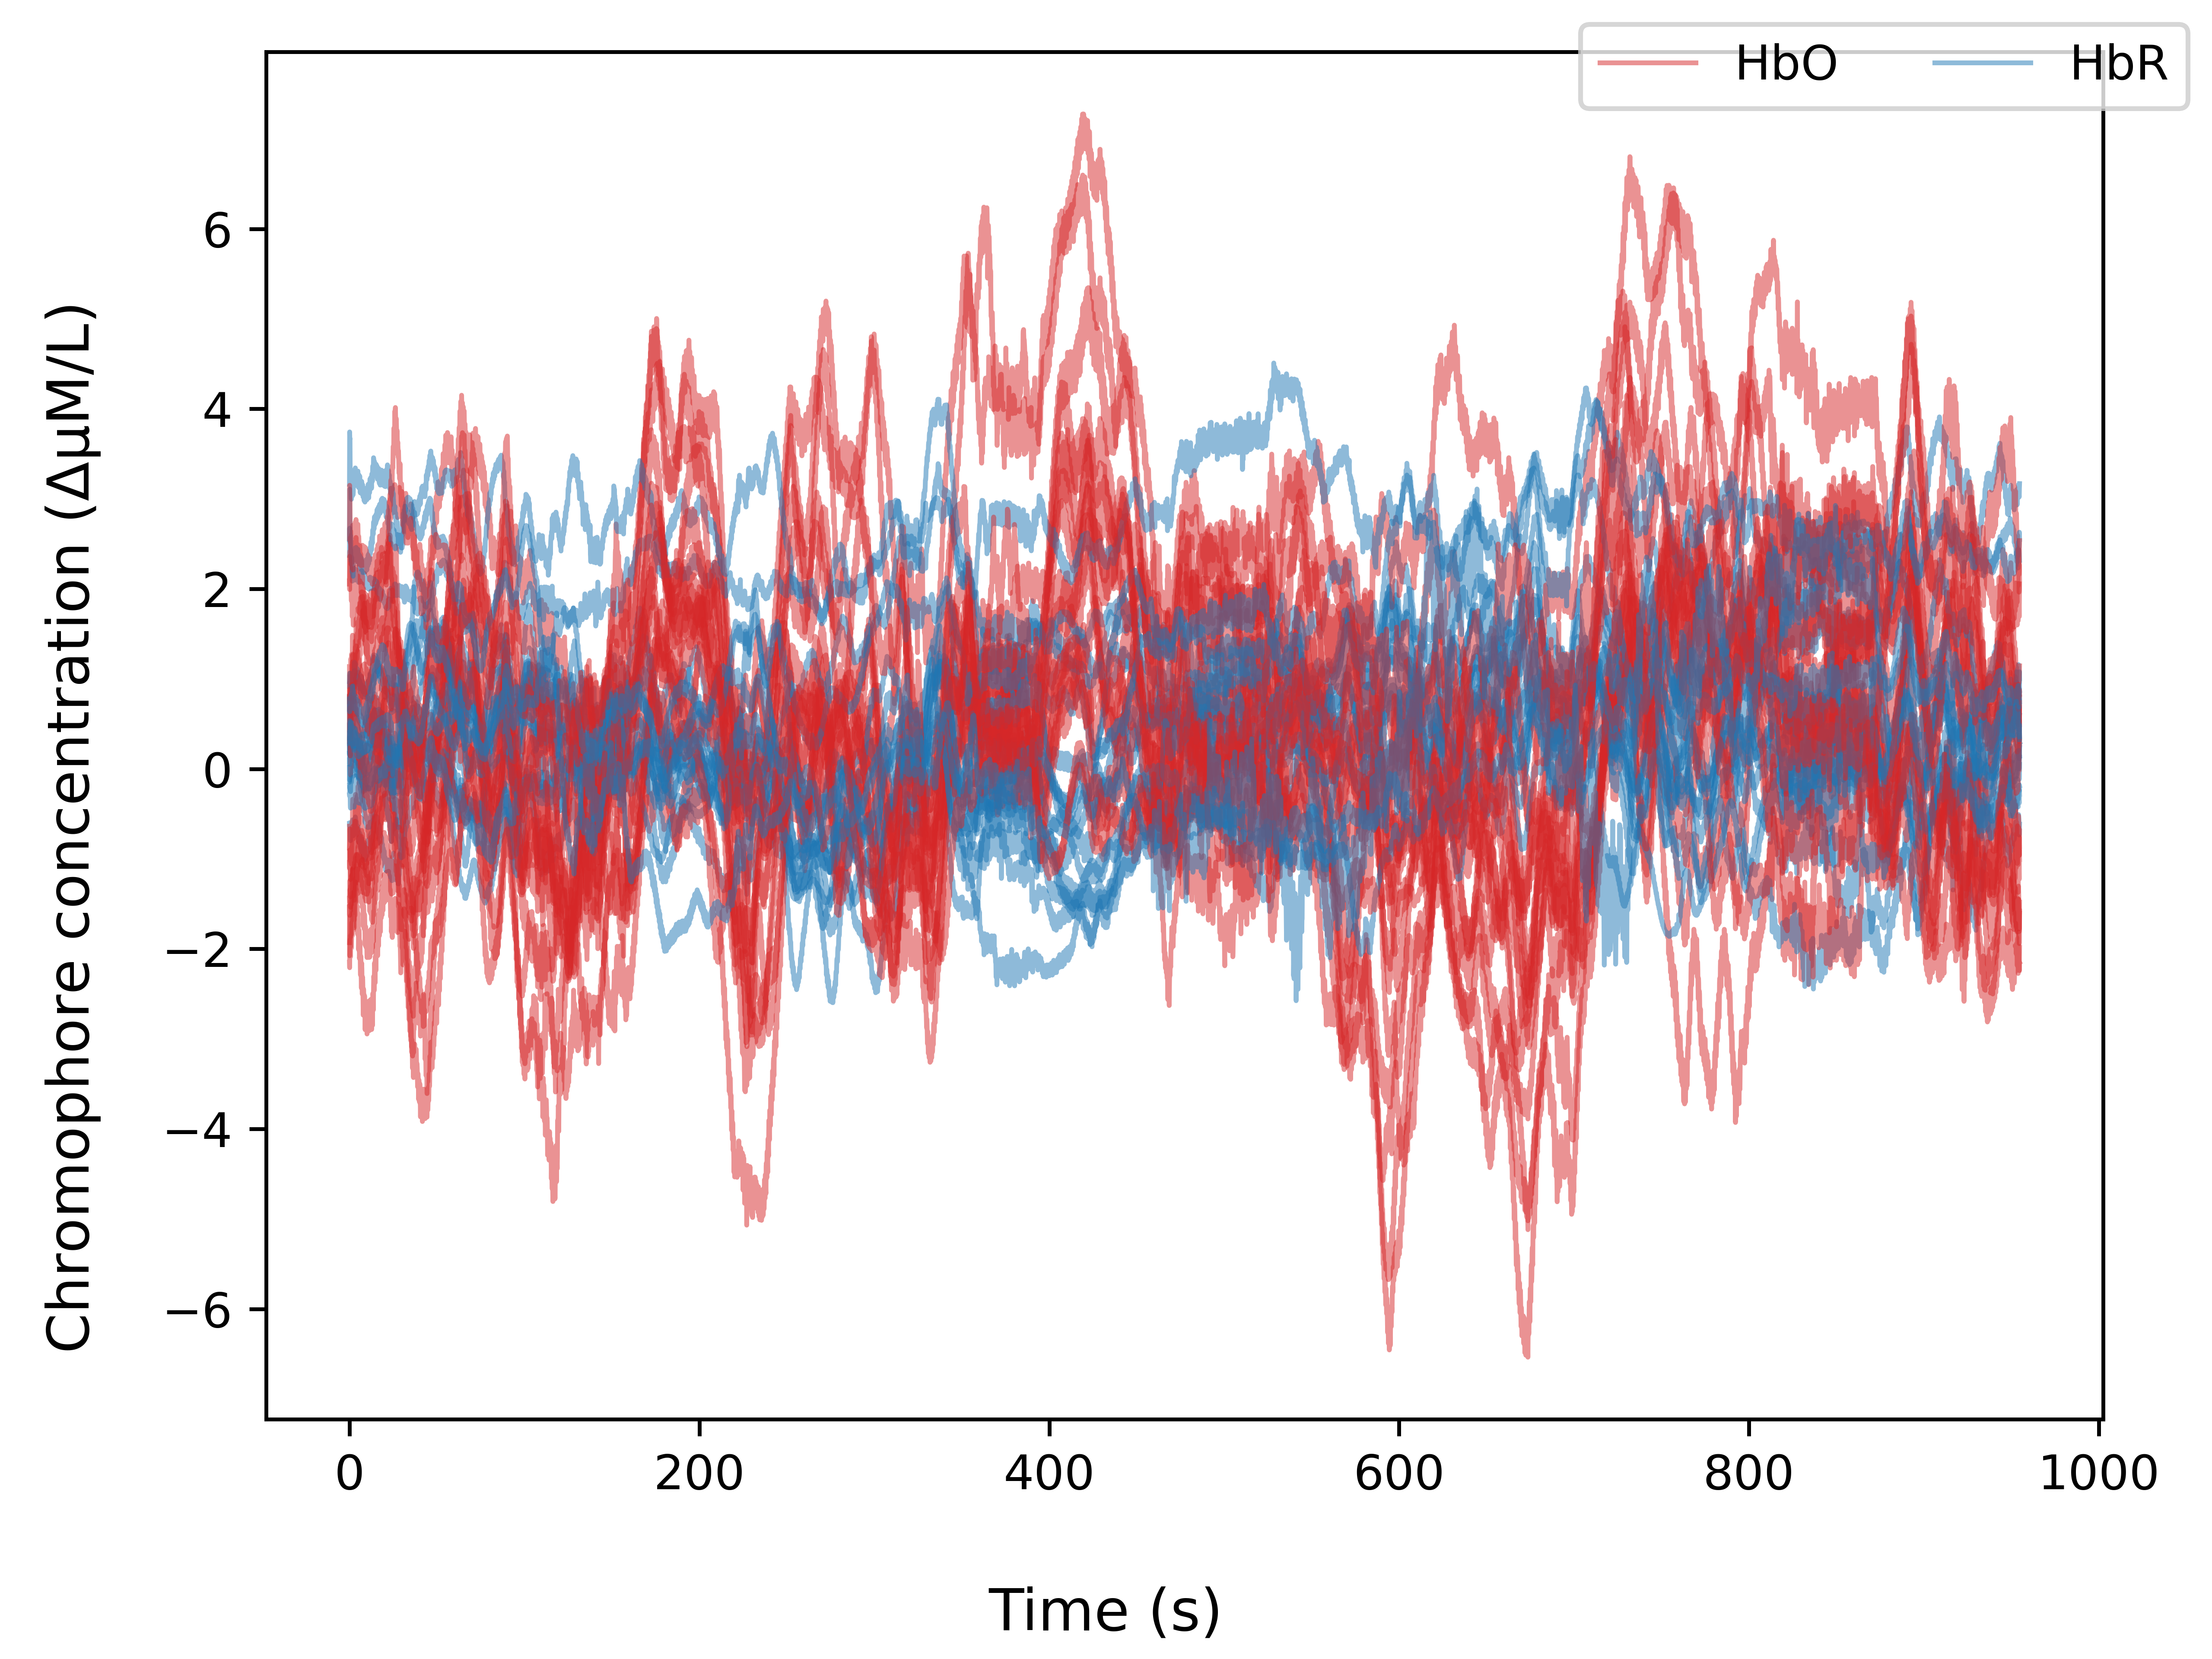
Concentration of HbO and HbR
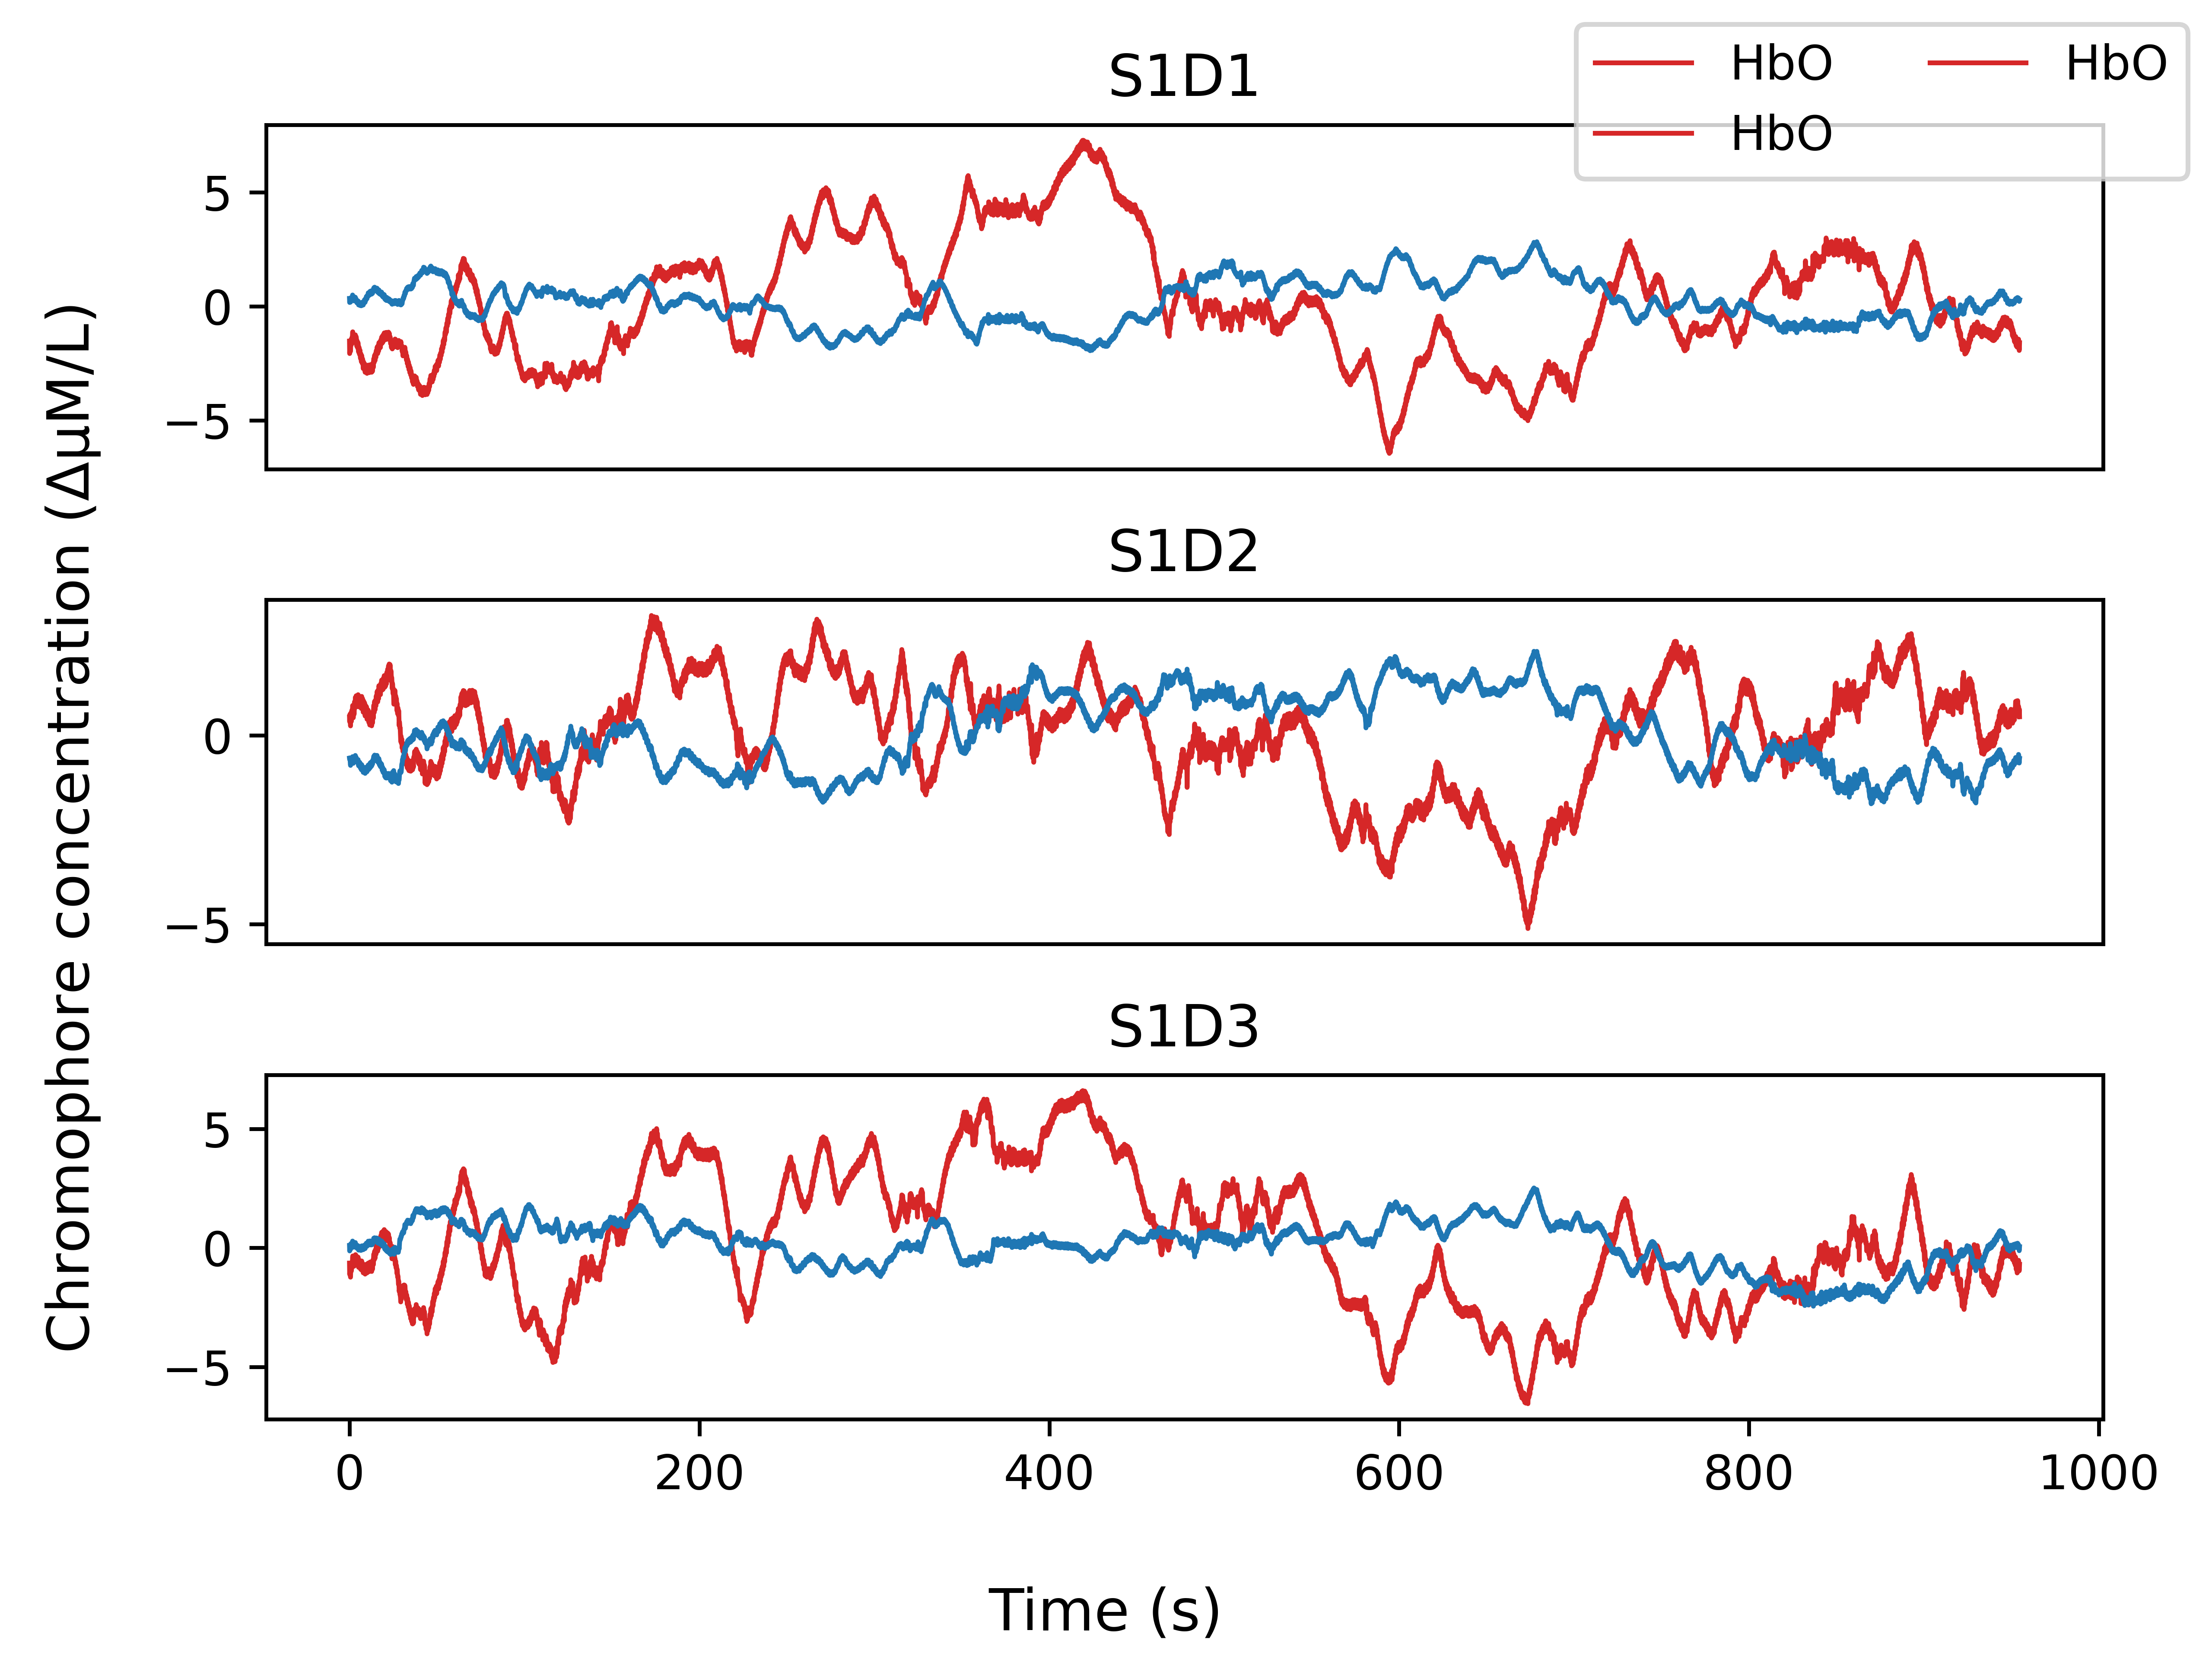
Concentration of HbO and HbR
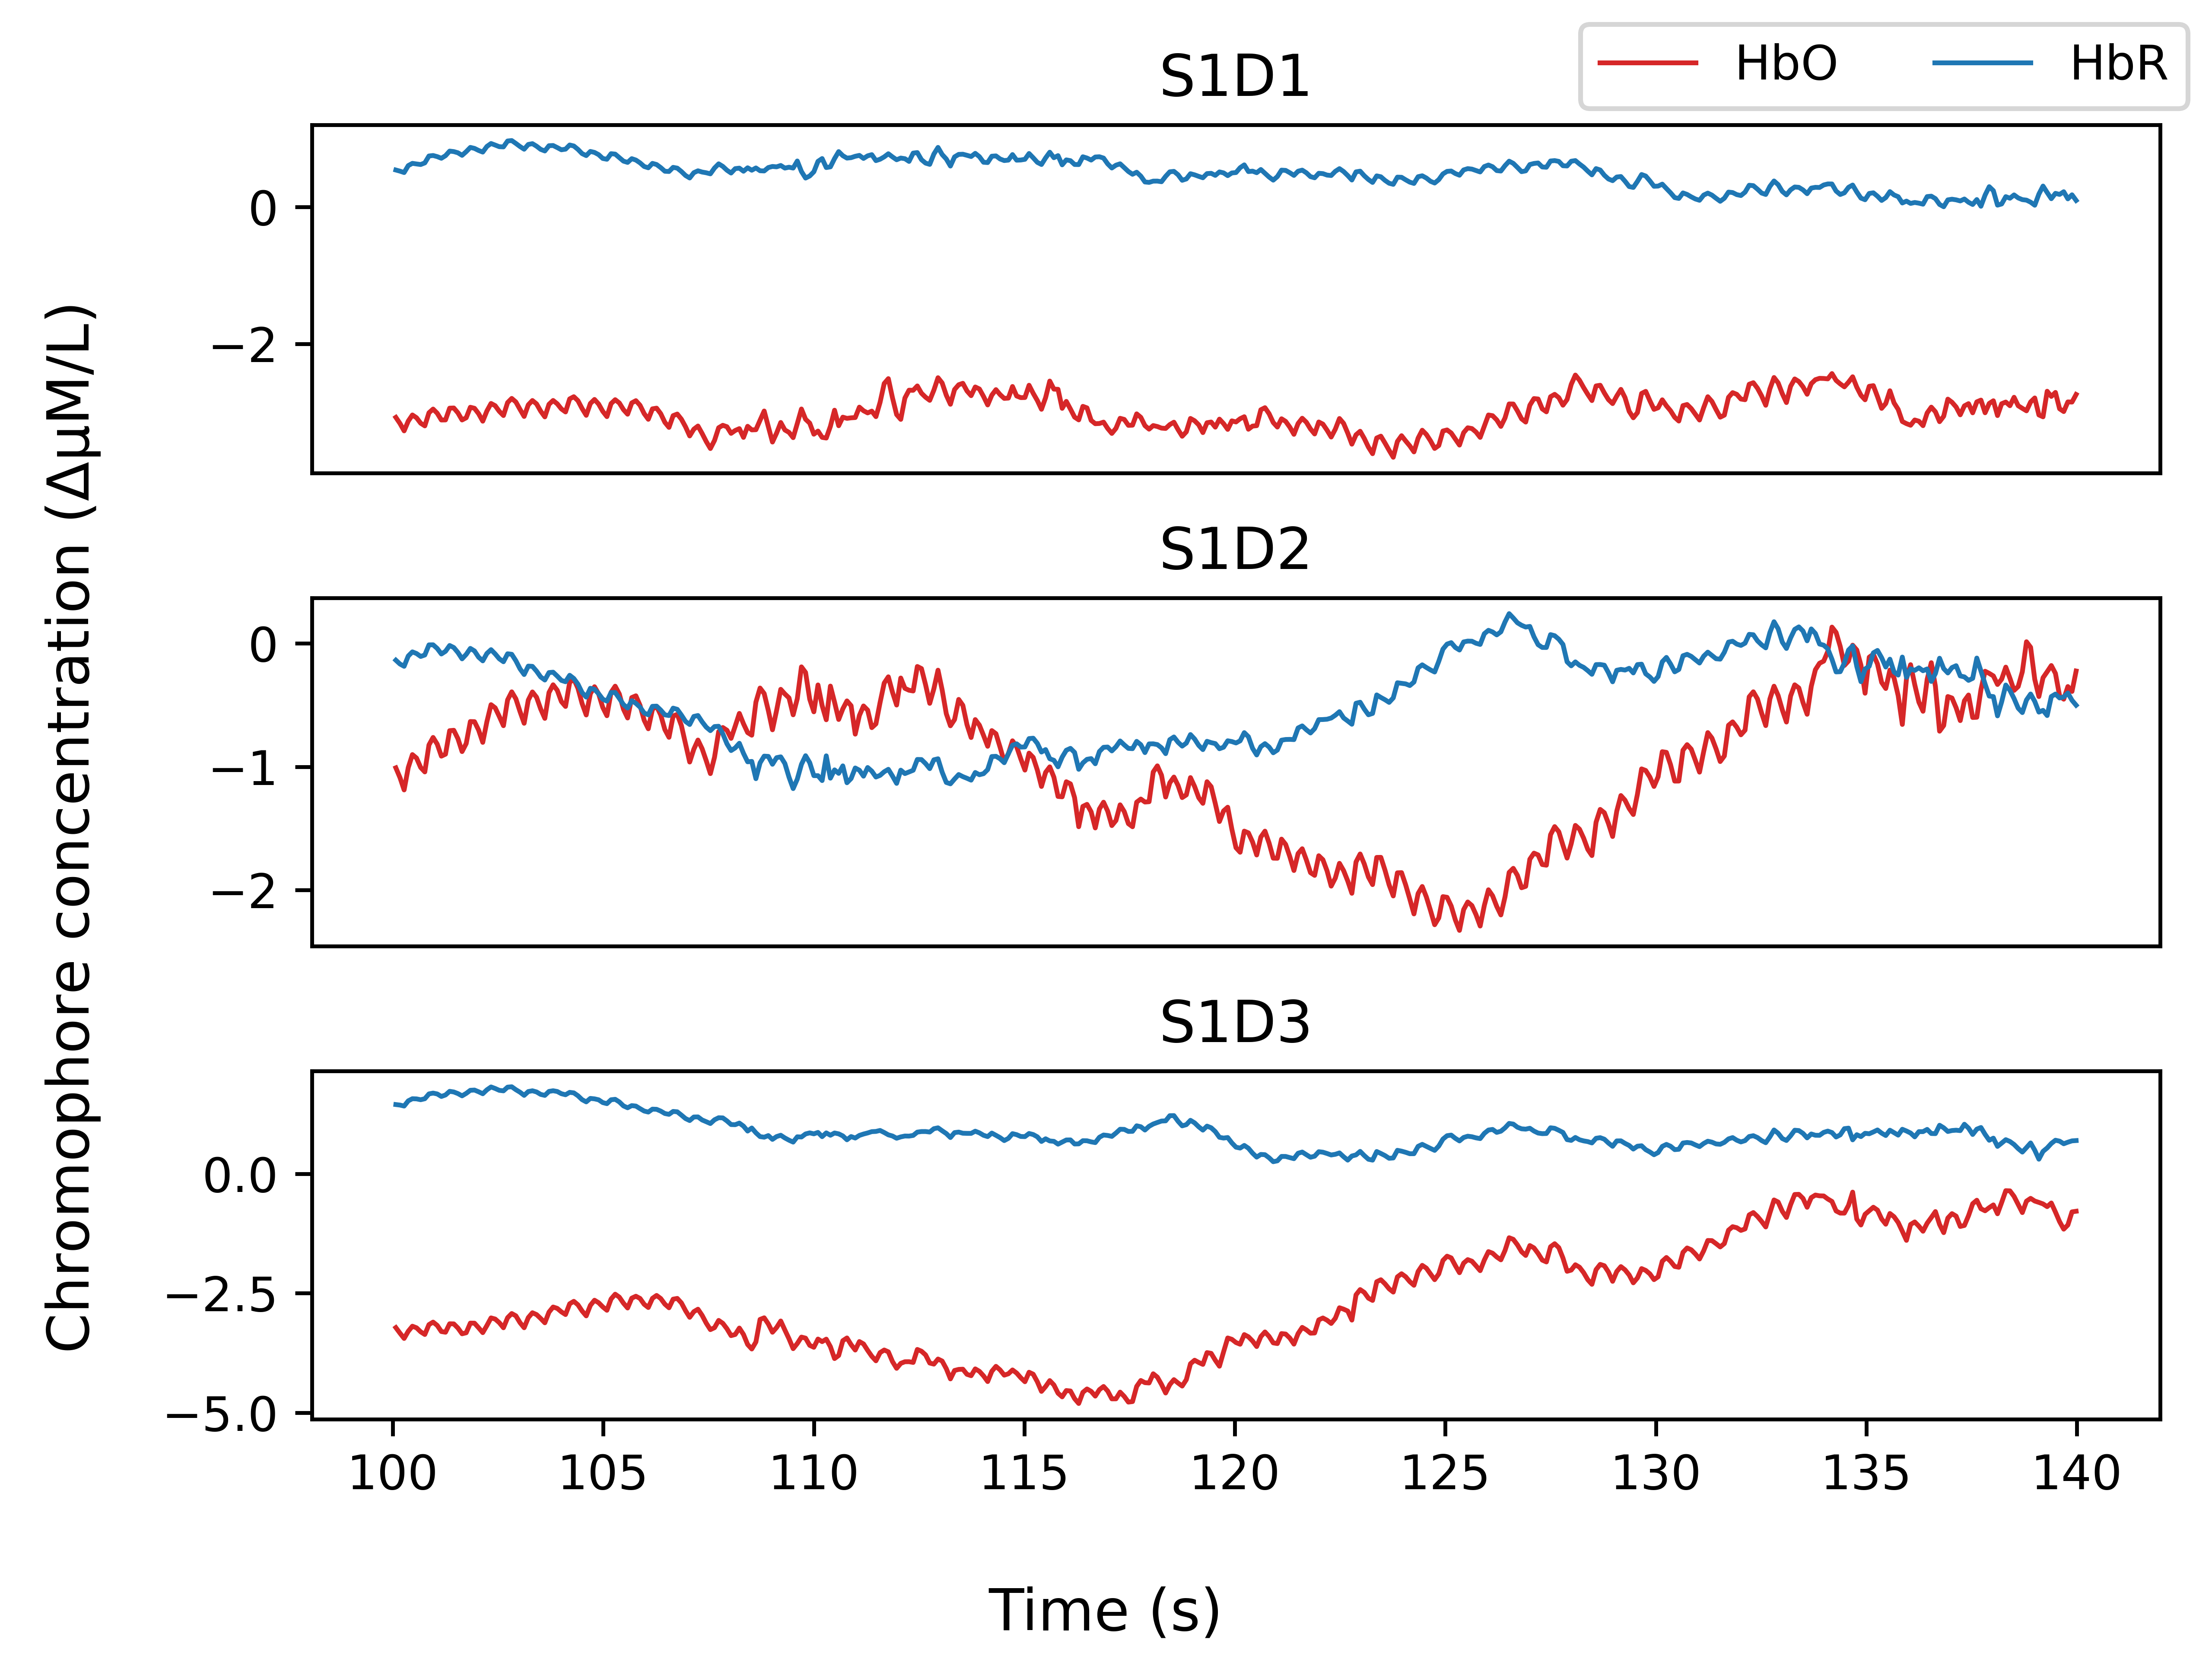
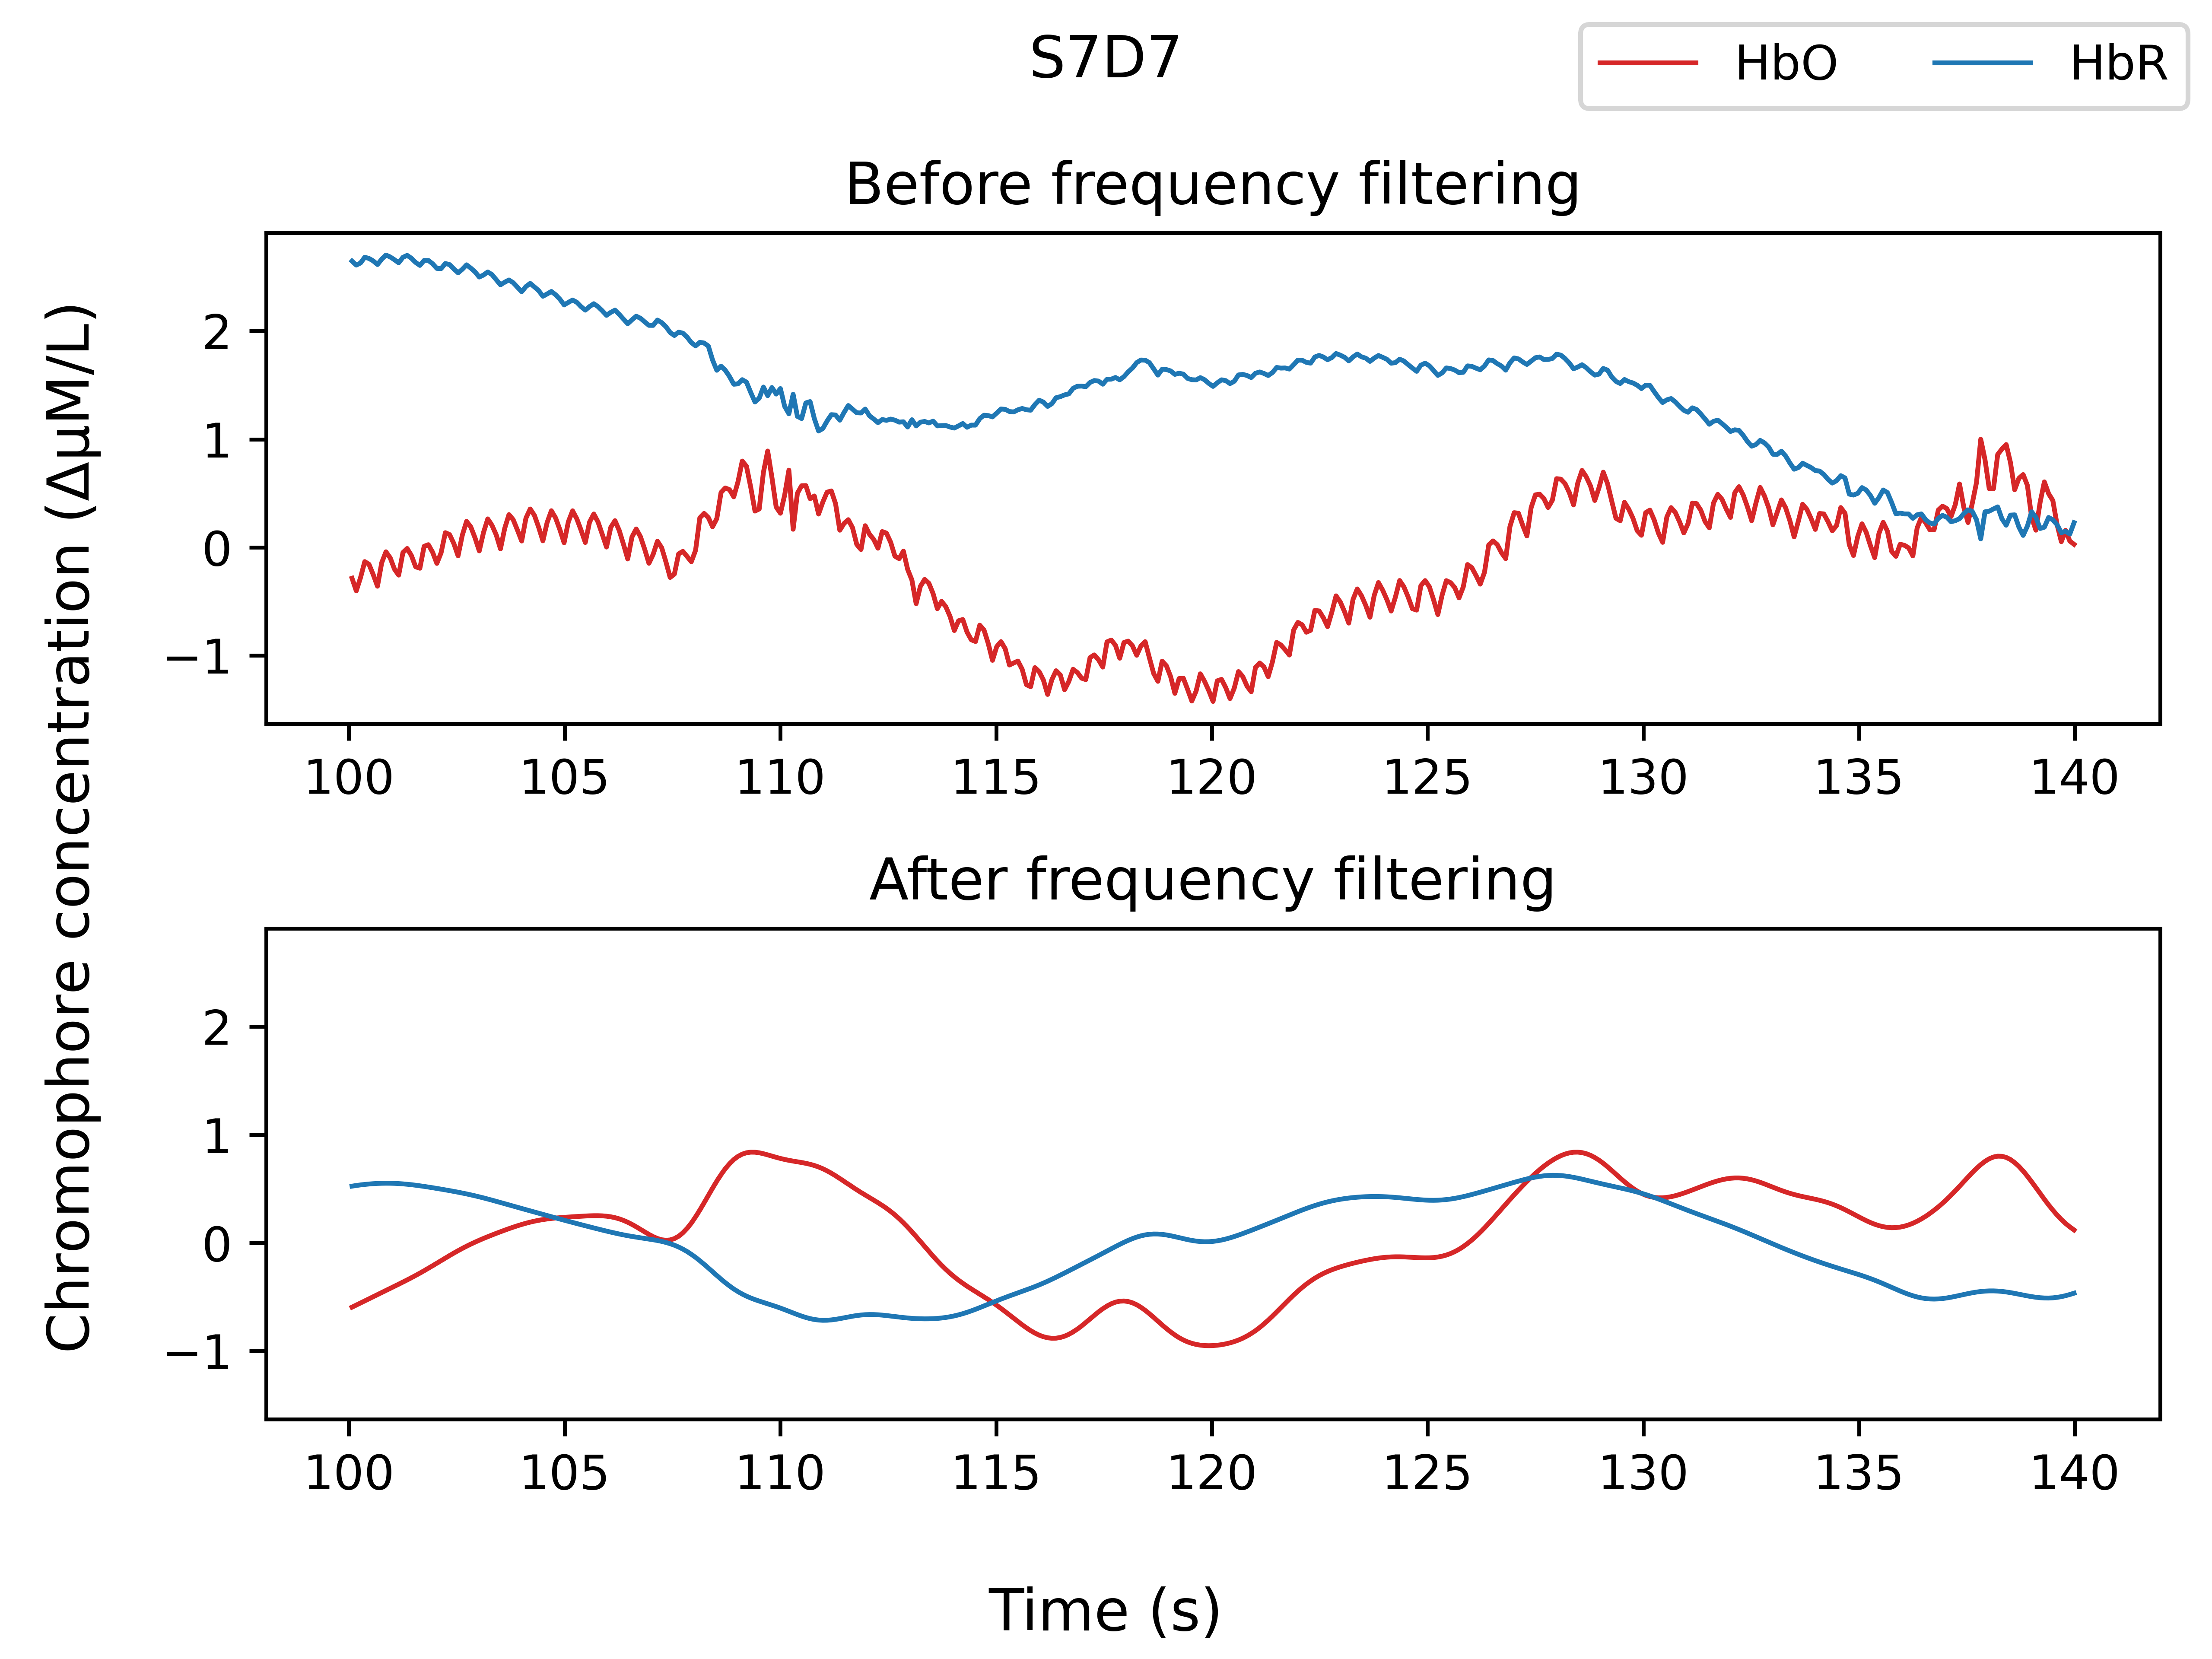
Physiological arctifact attenuation: frequency filtering
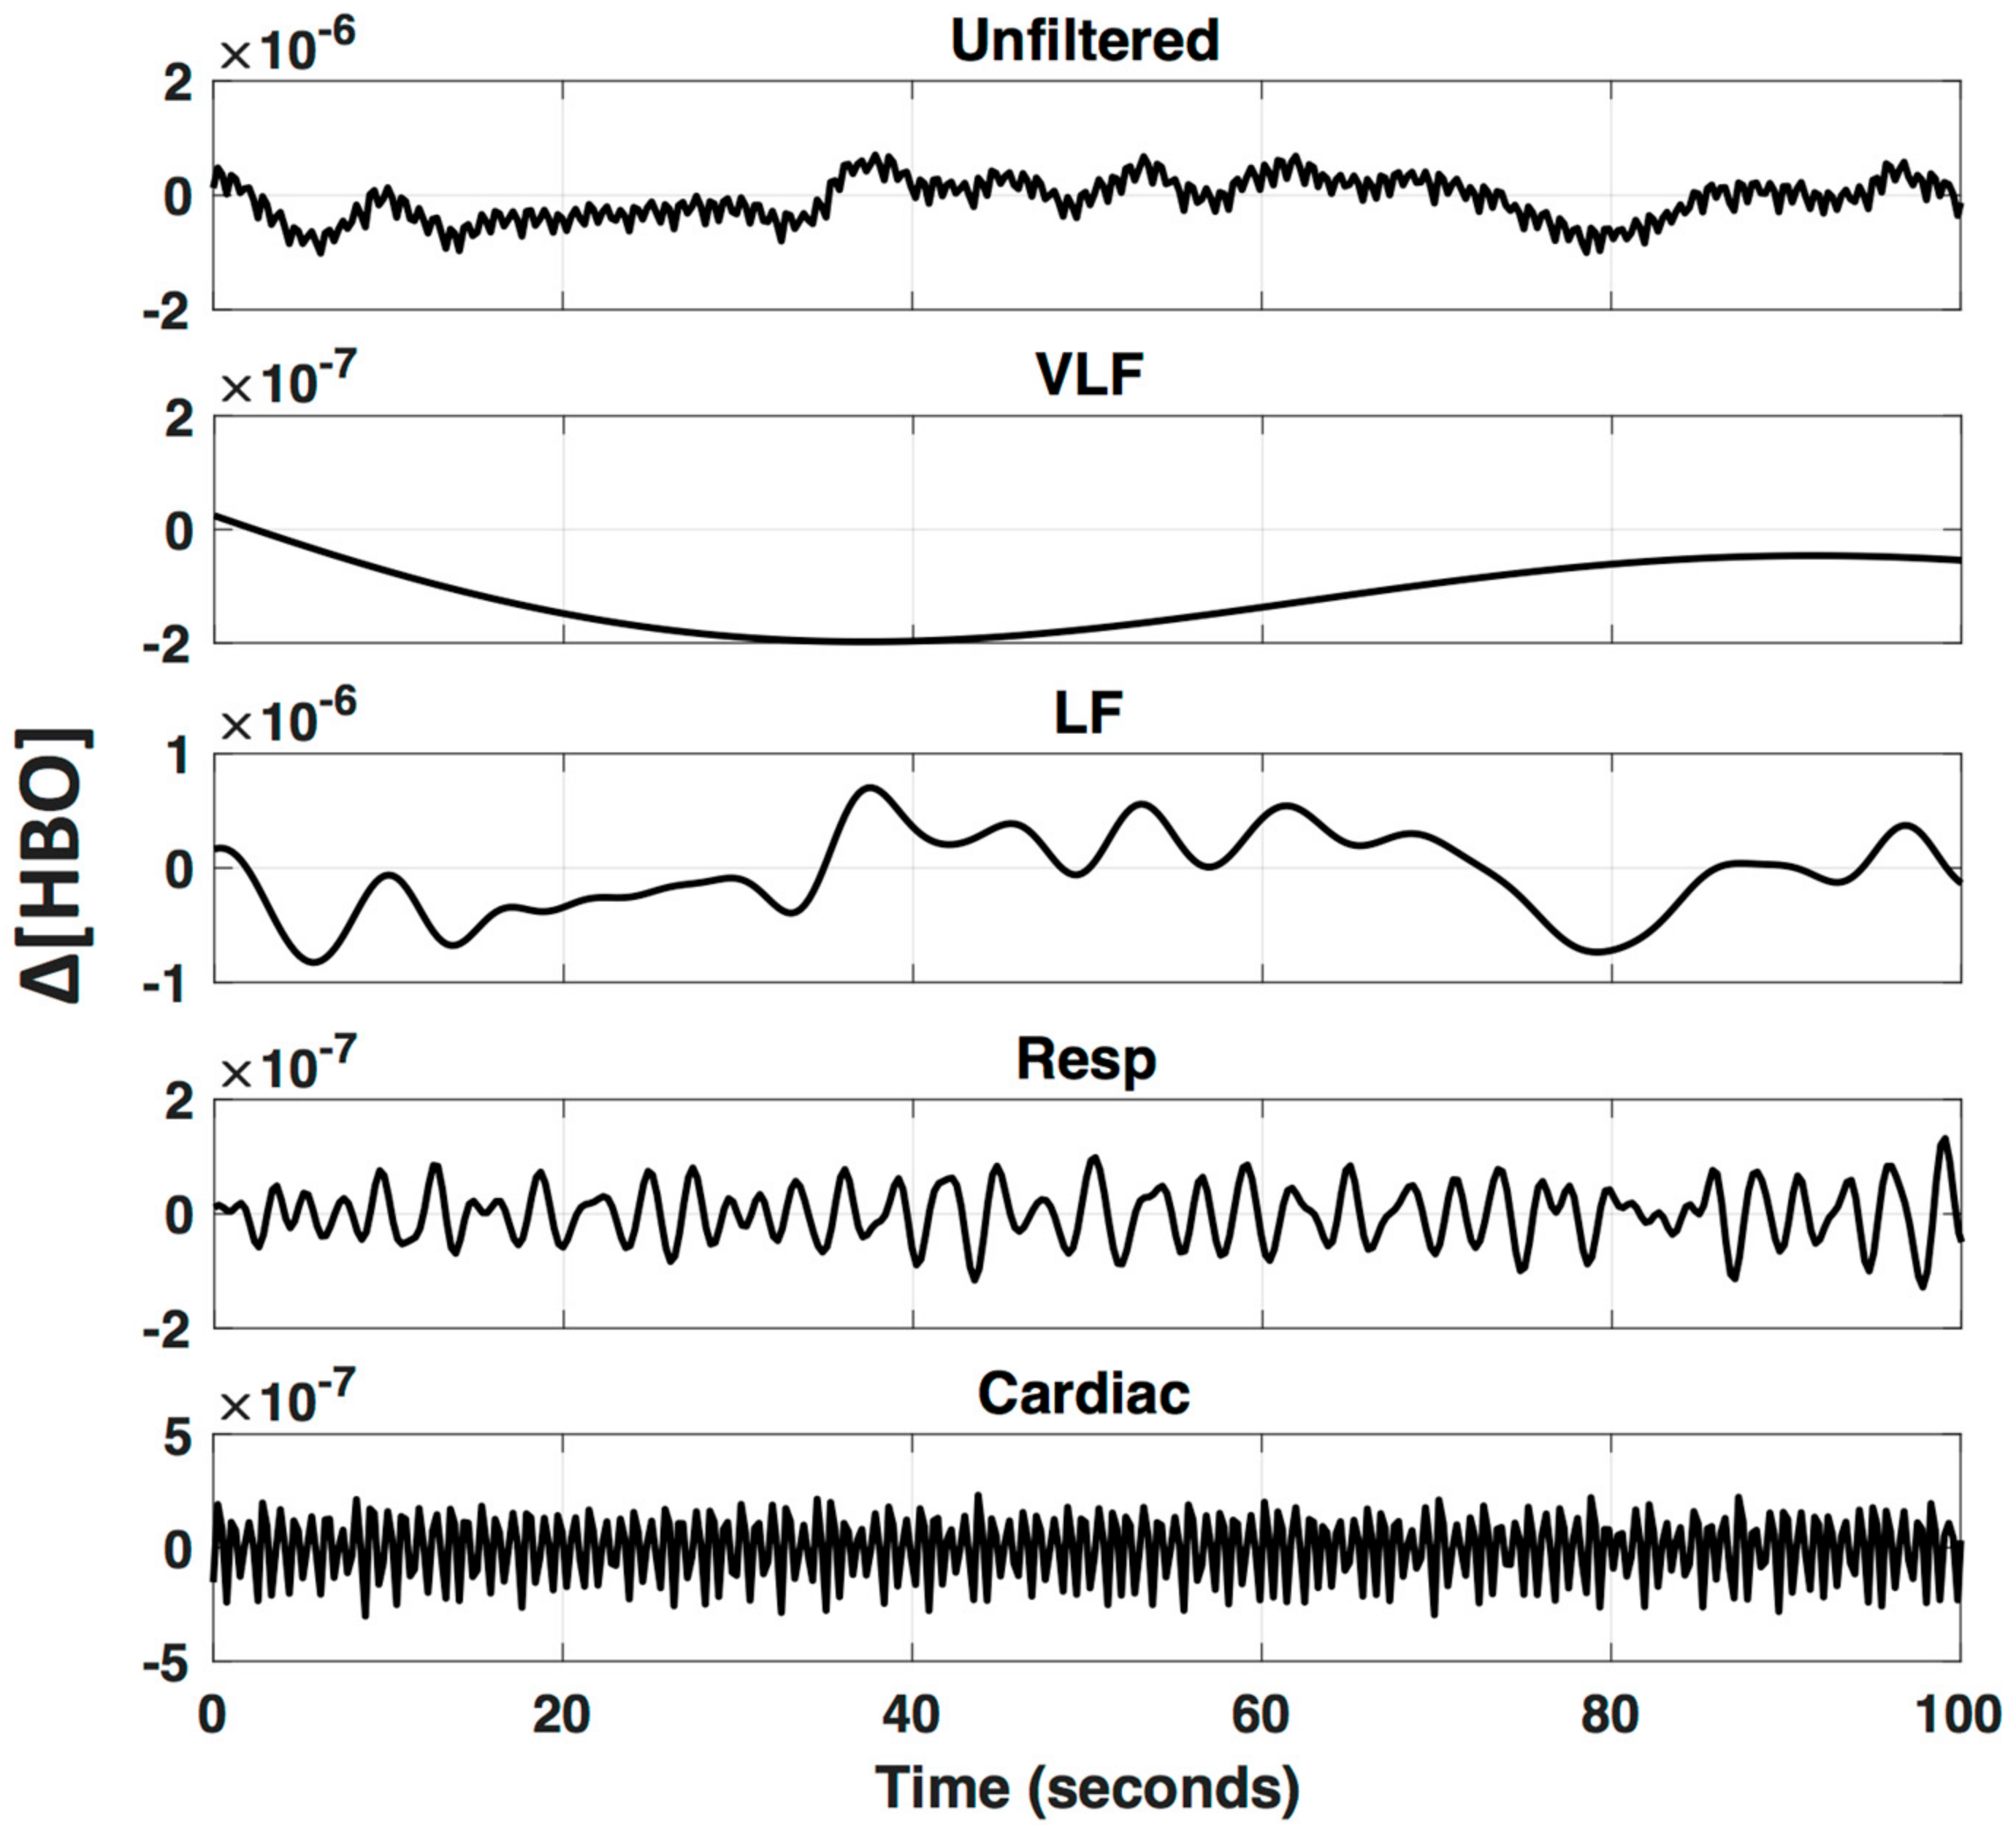
Hocke et al. (2018)
Physiological arctifact attenuation: frequency filtering
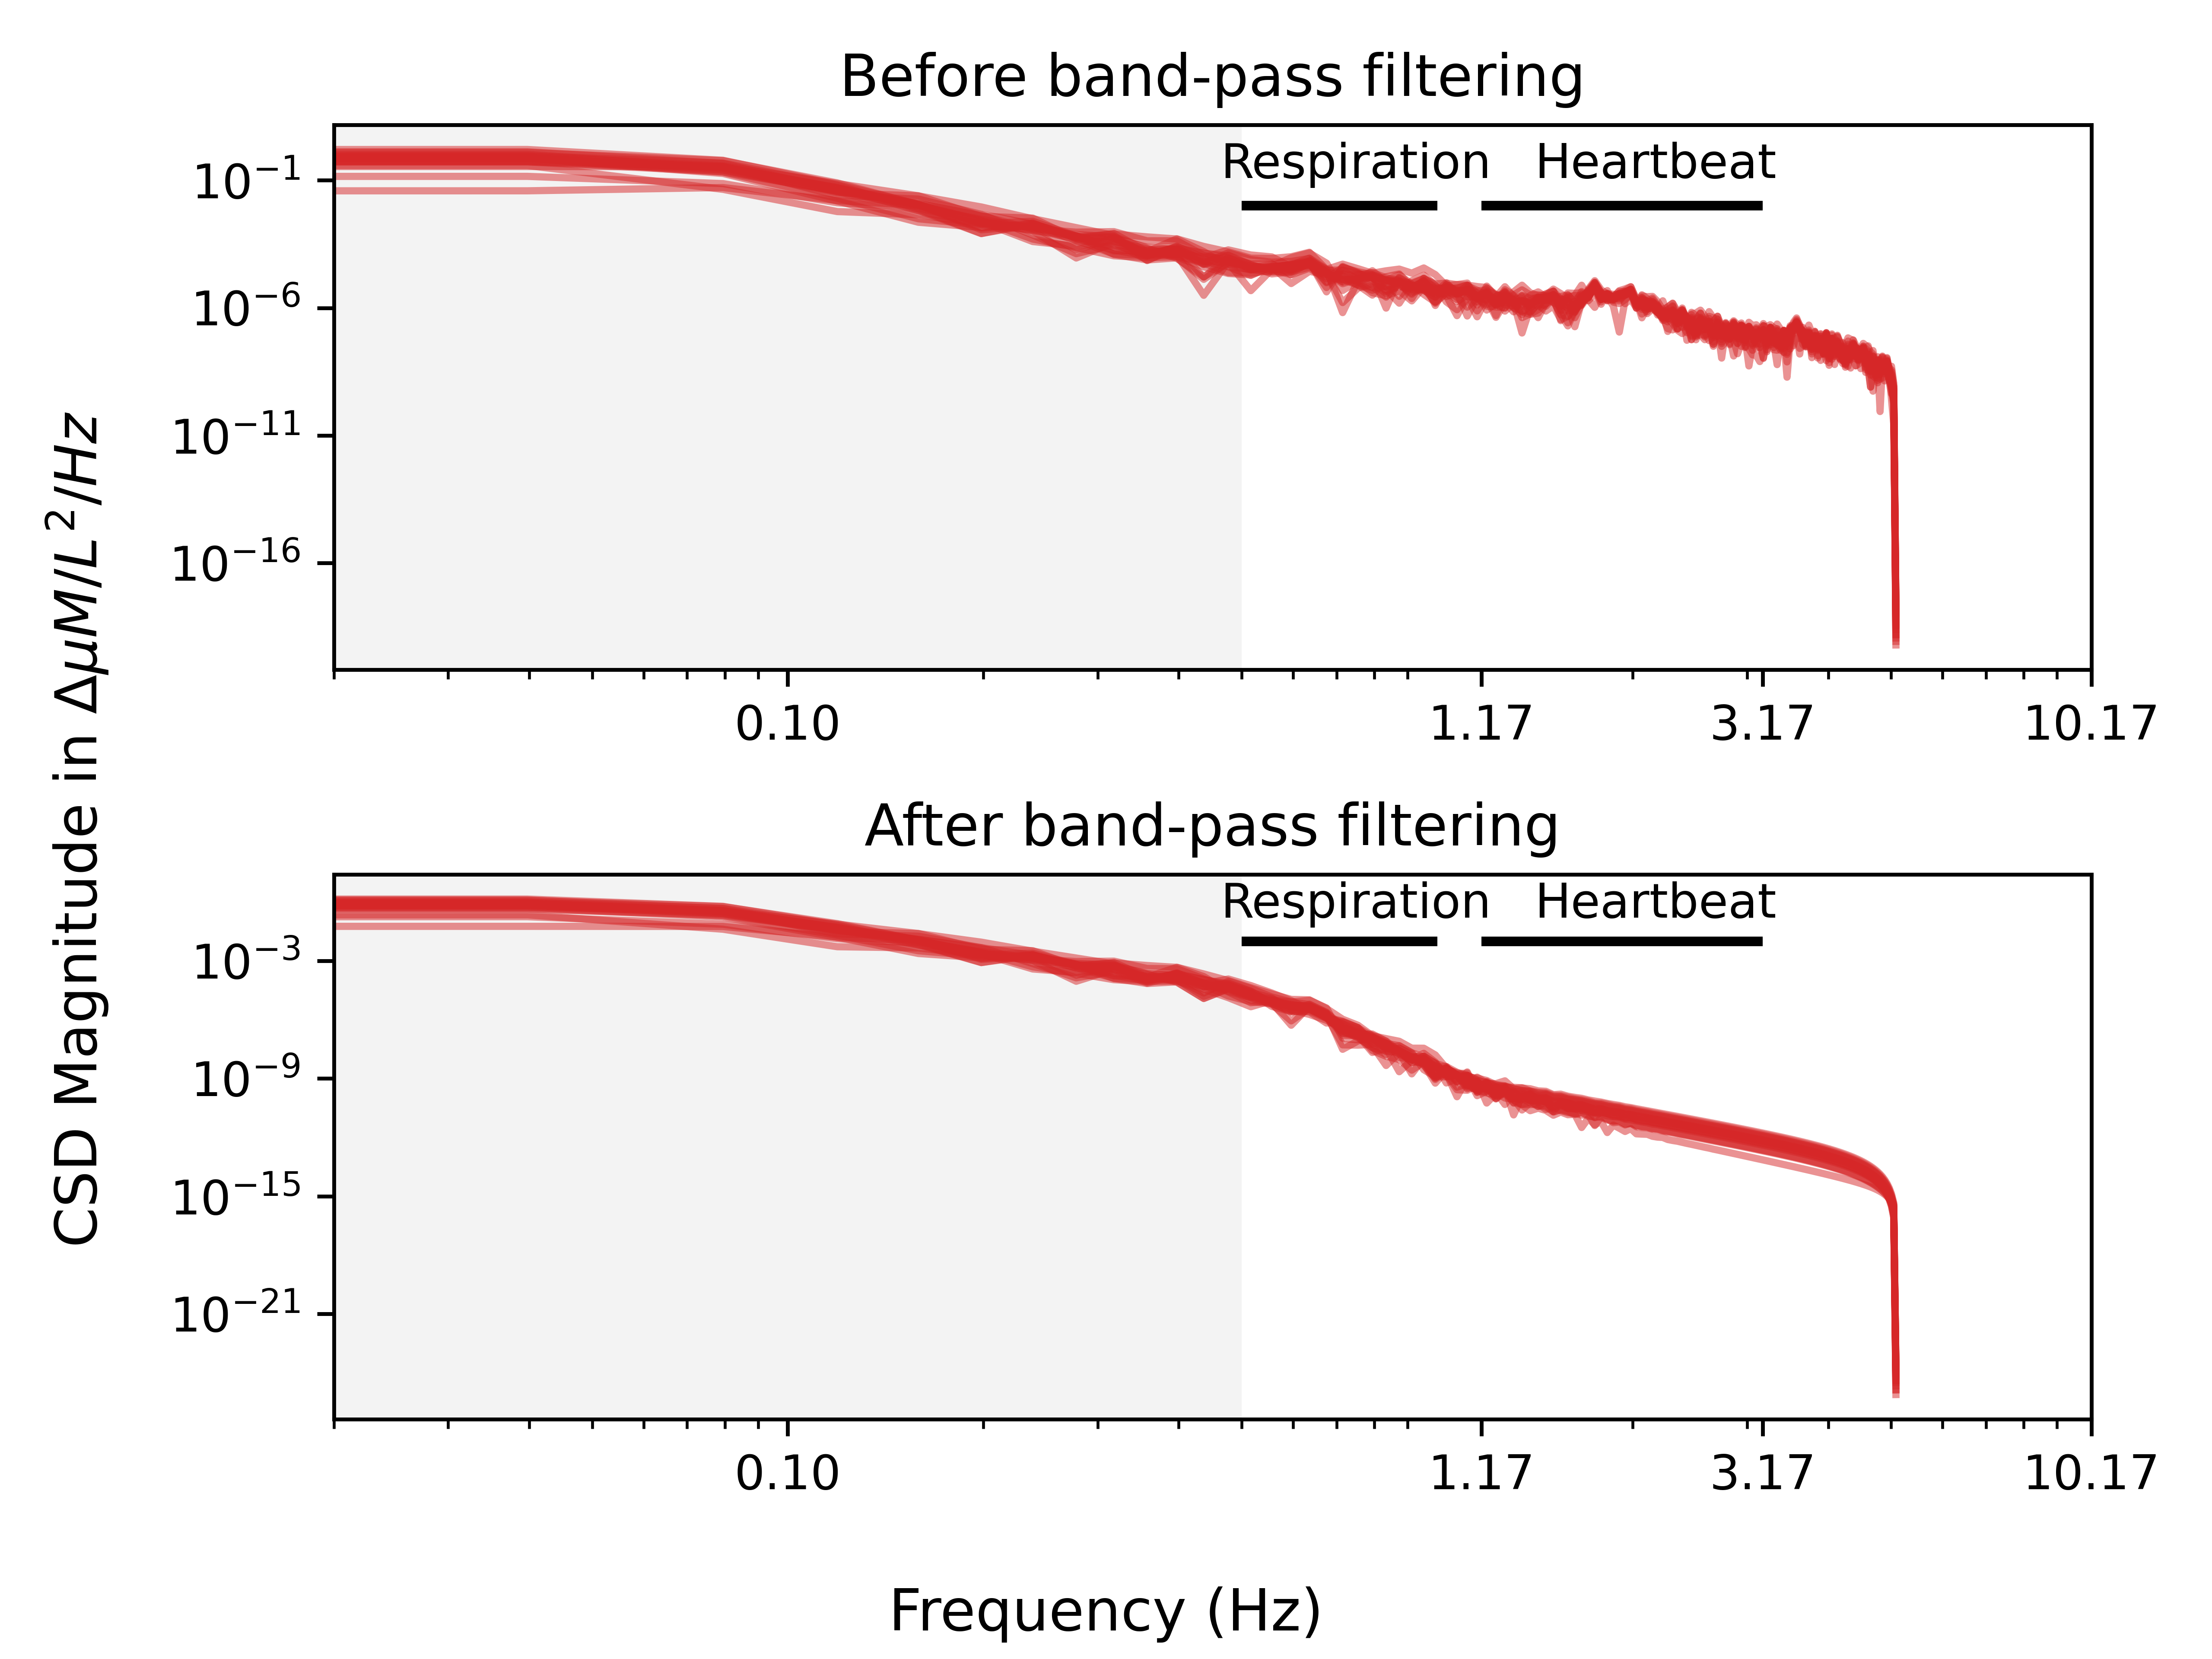
Physiological arctifact attenuation: frequency filtering
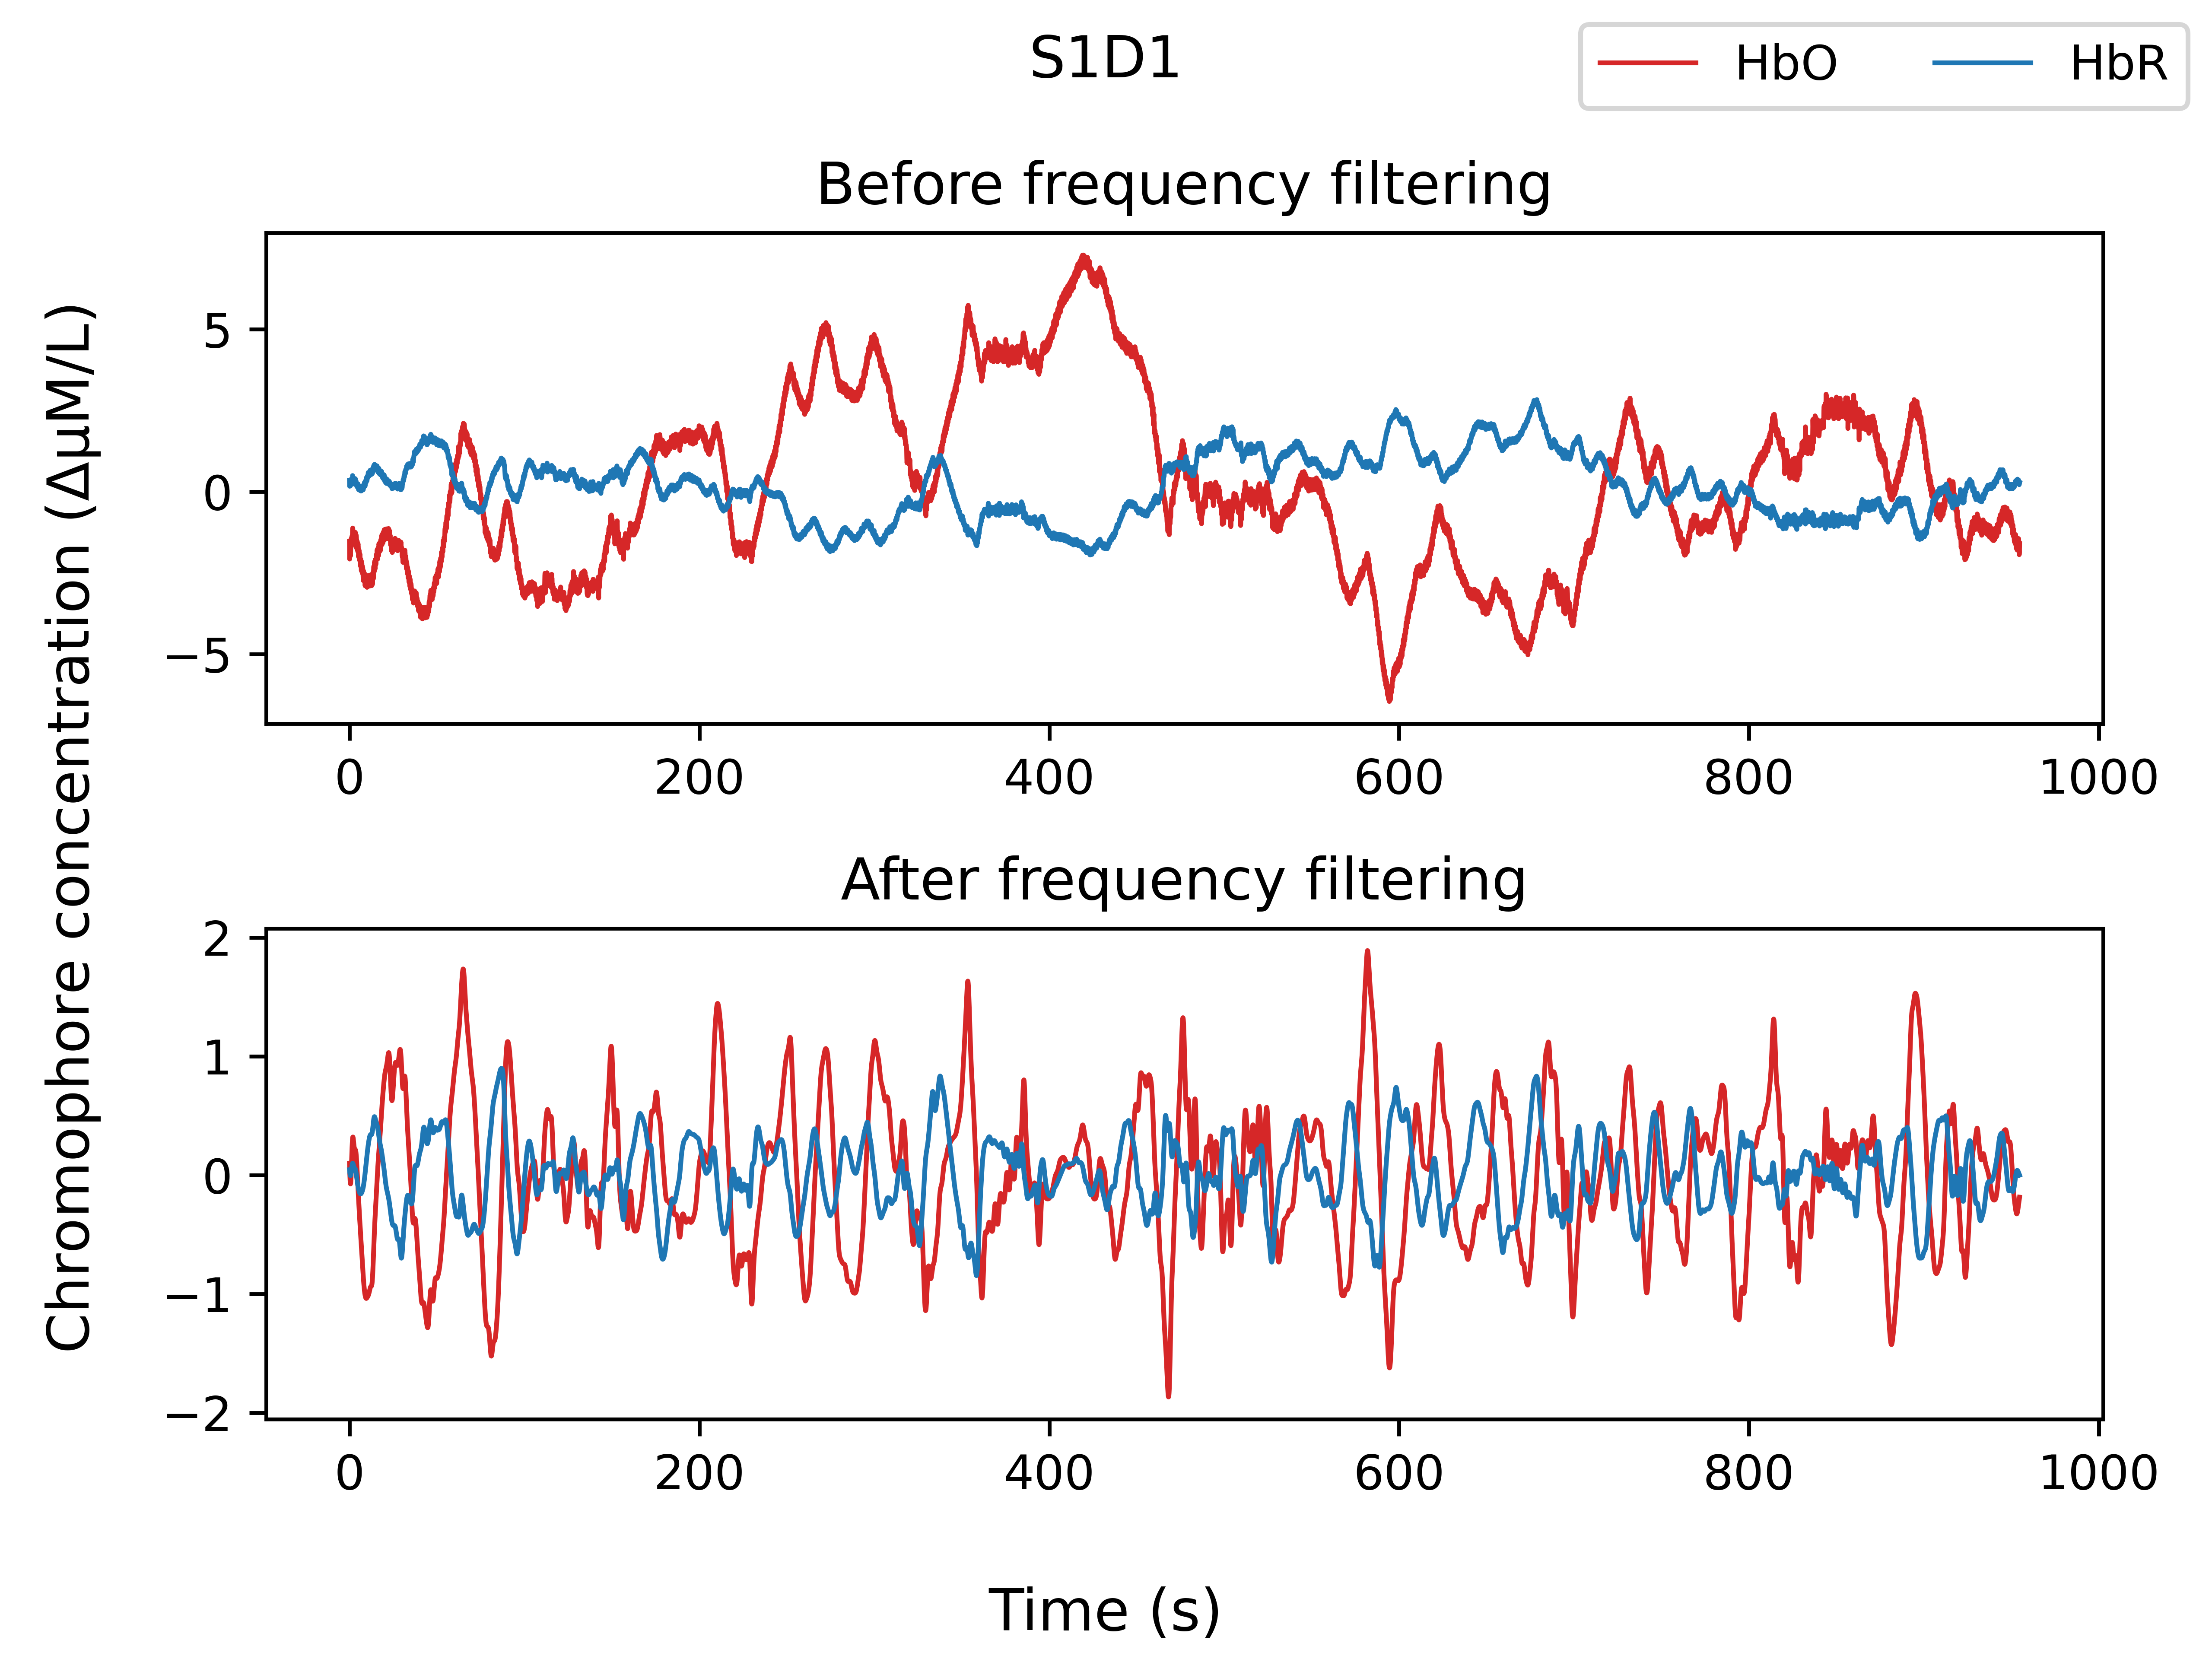
Physiological arctifact attenuation: frequency filtering
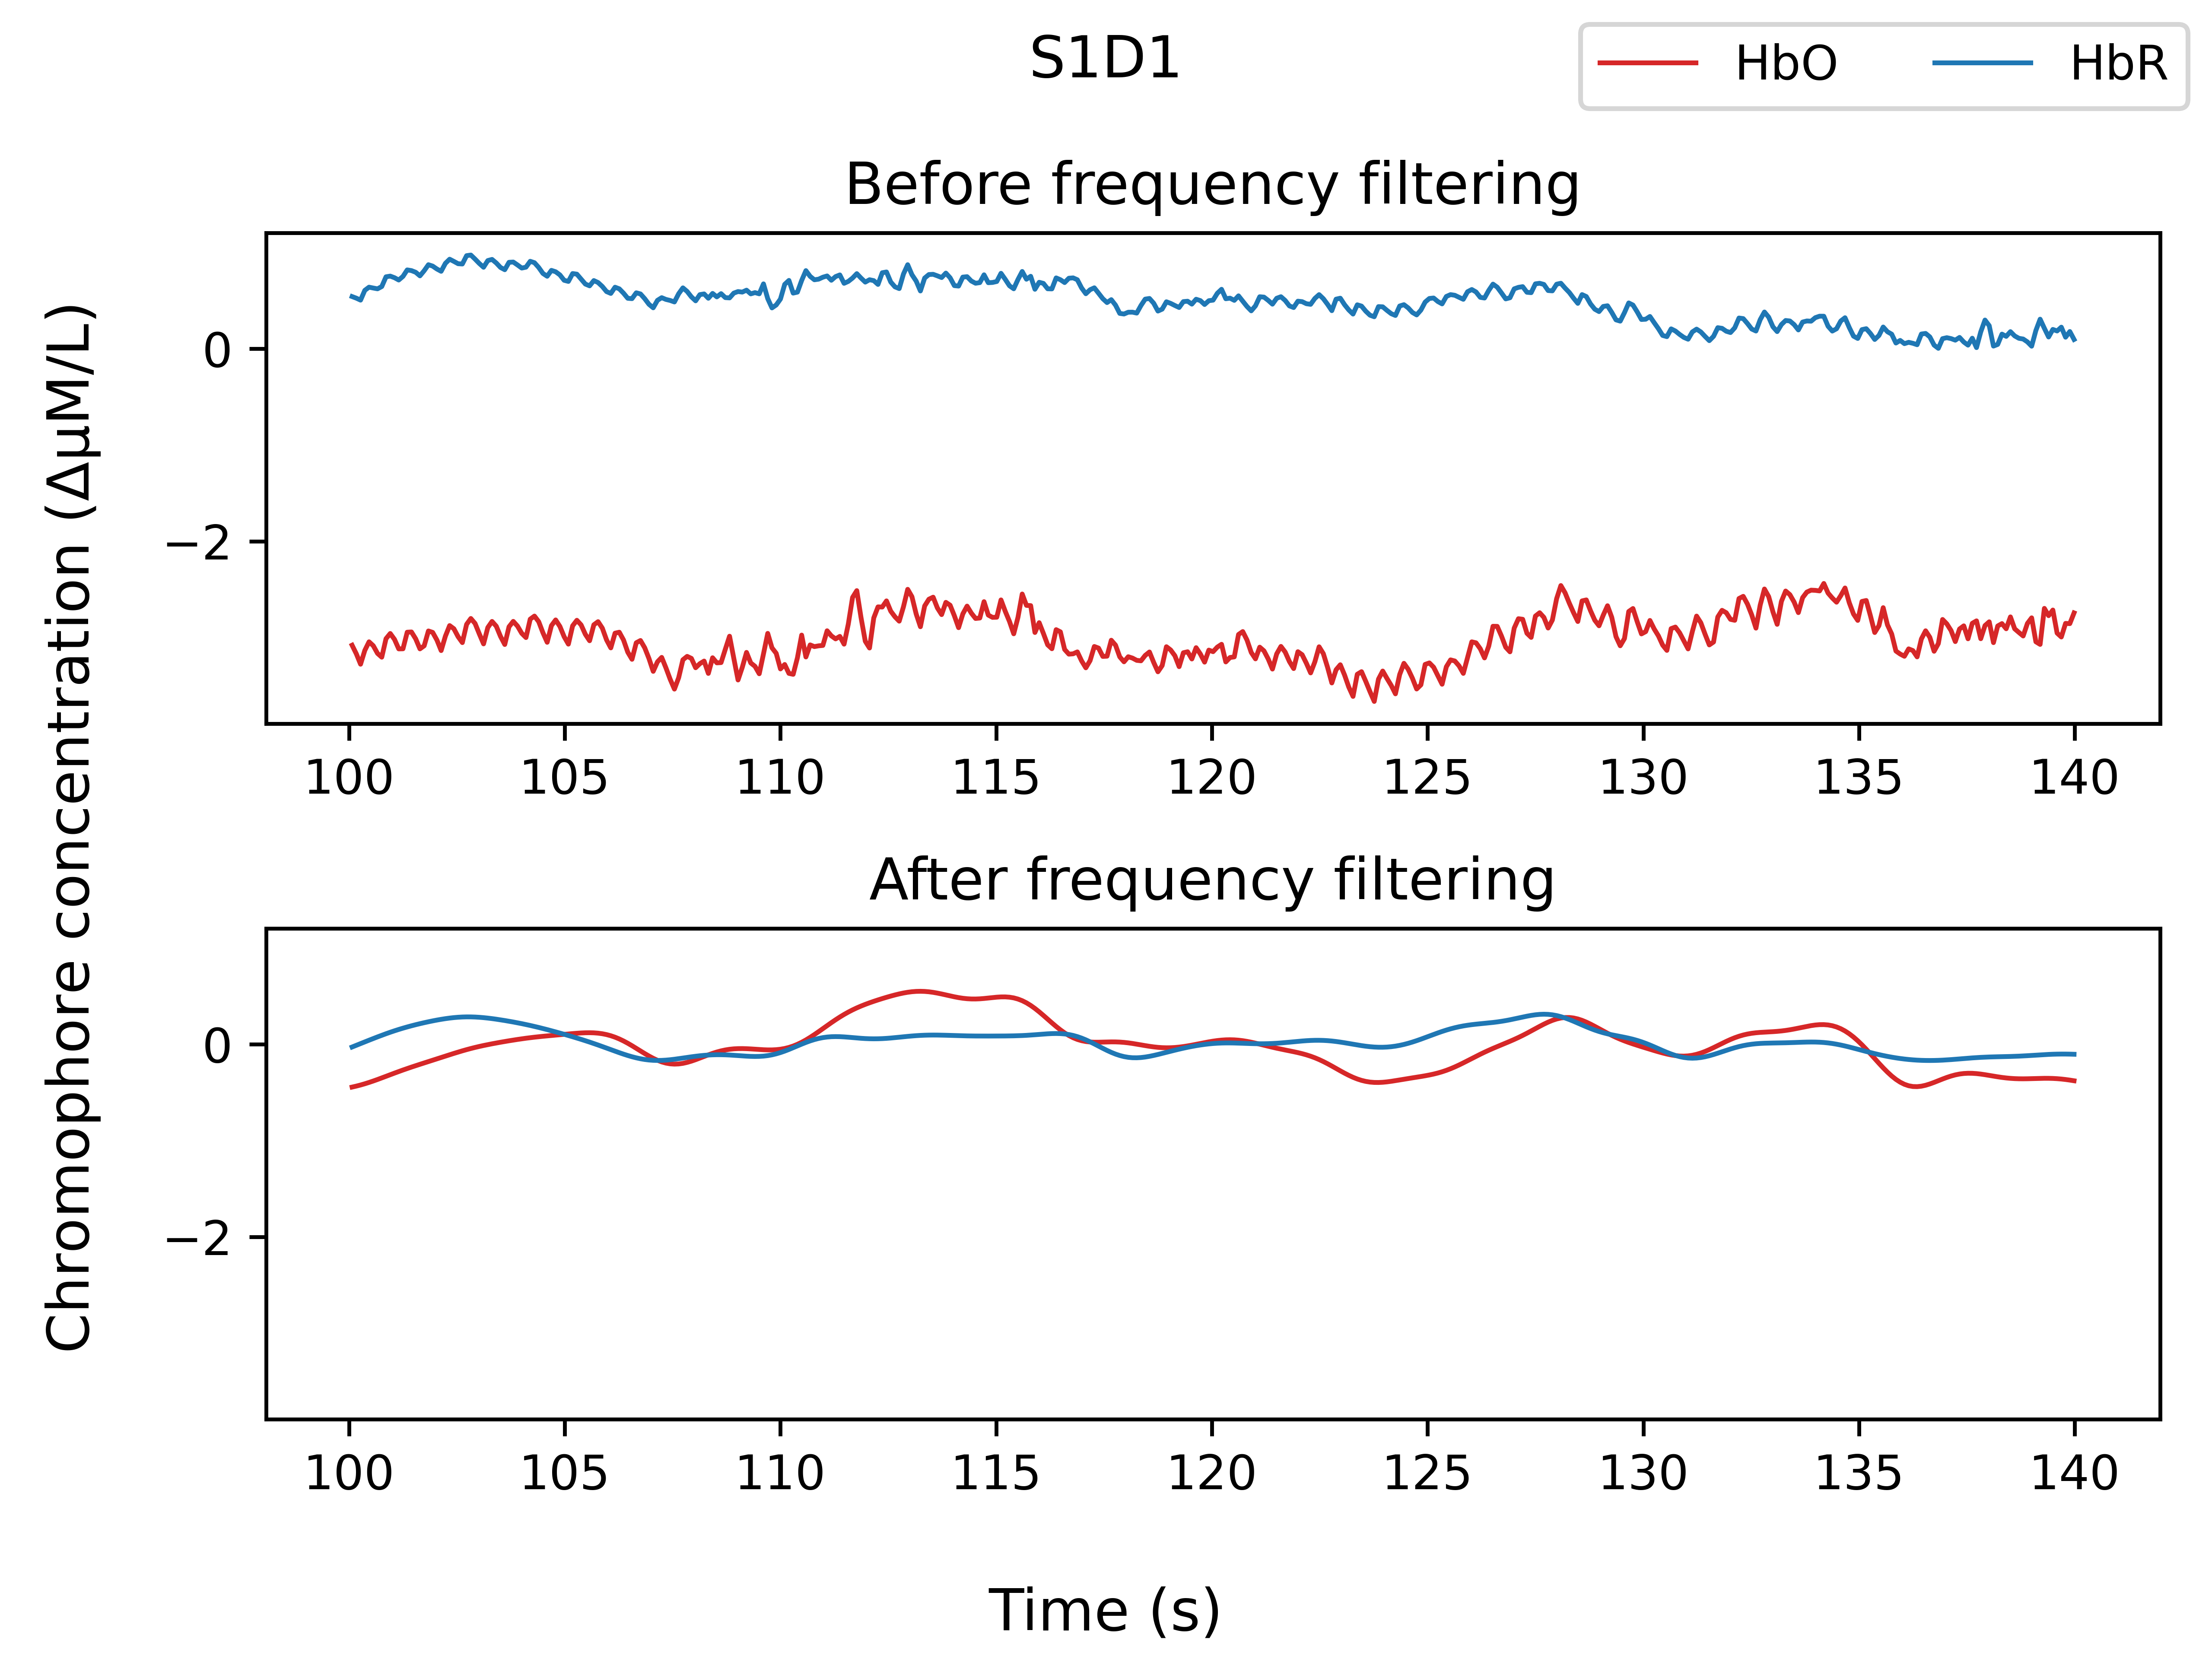
Physiological arctifact attenuation: frequency filtering
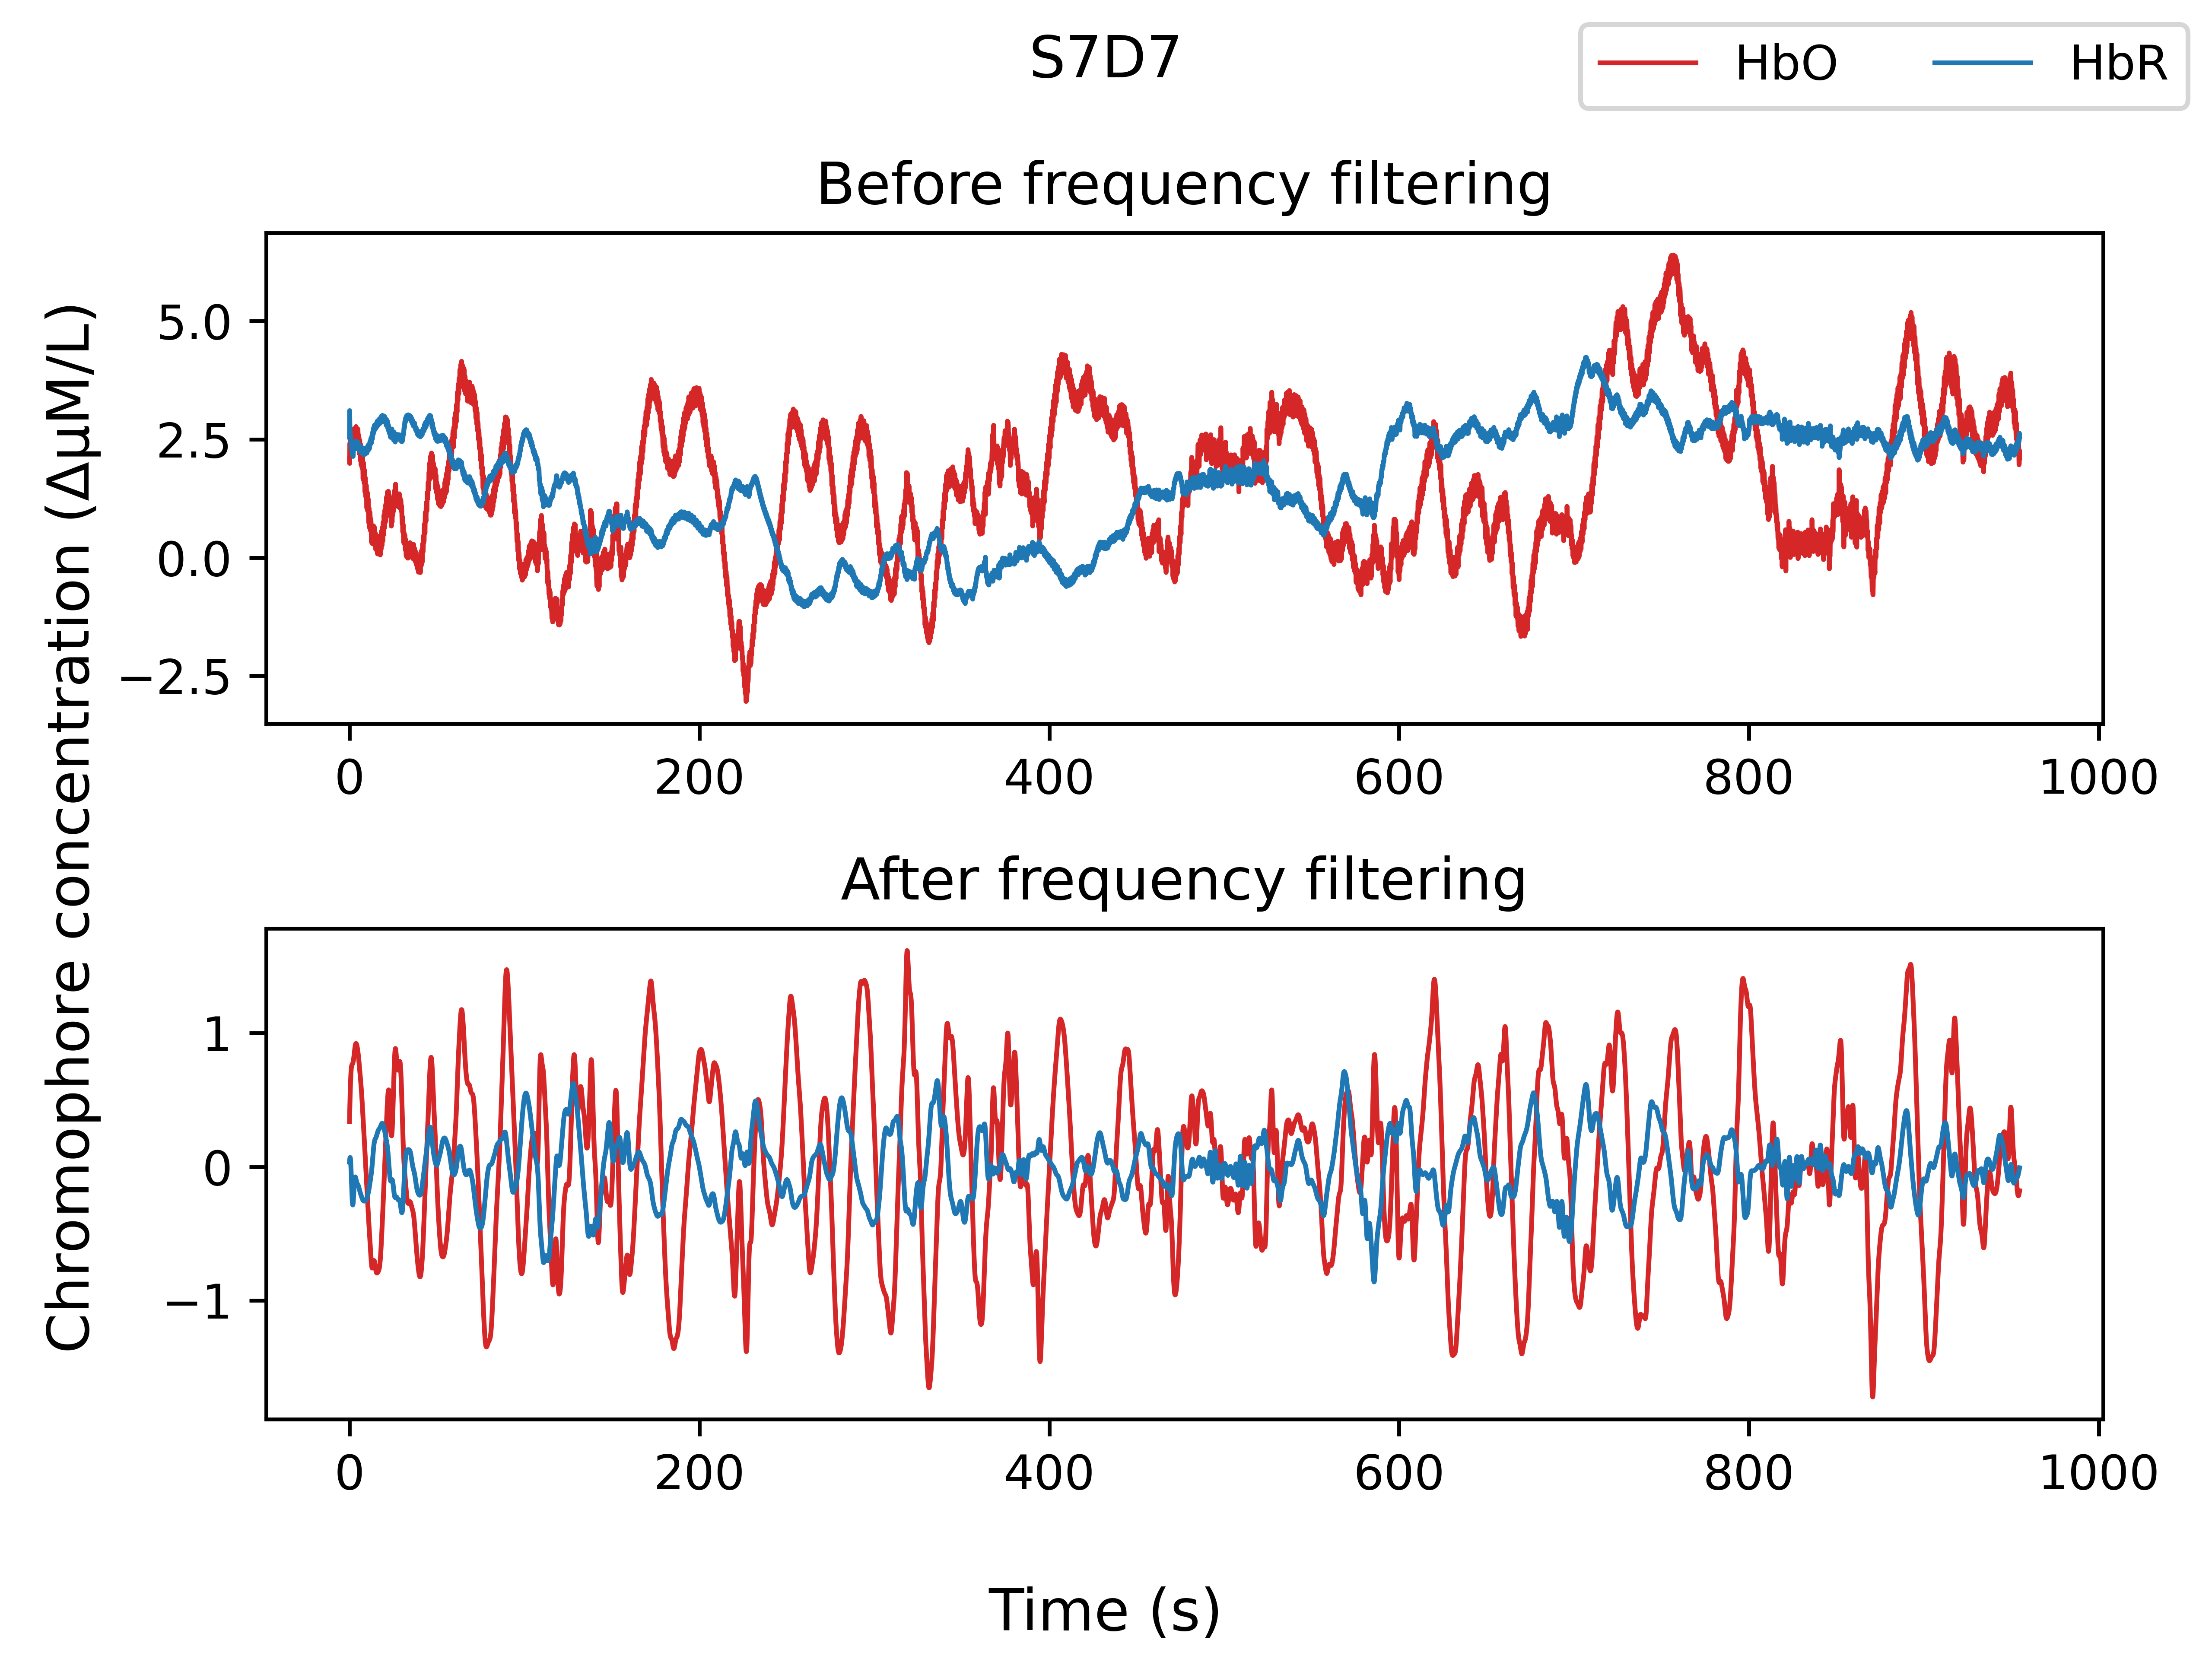
Physiological arctifact attenuation: frequency filtering
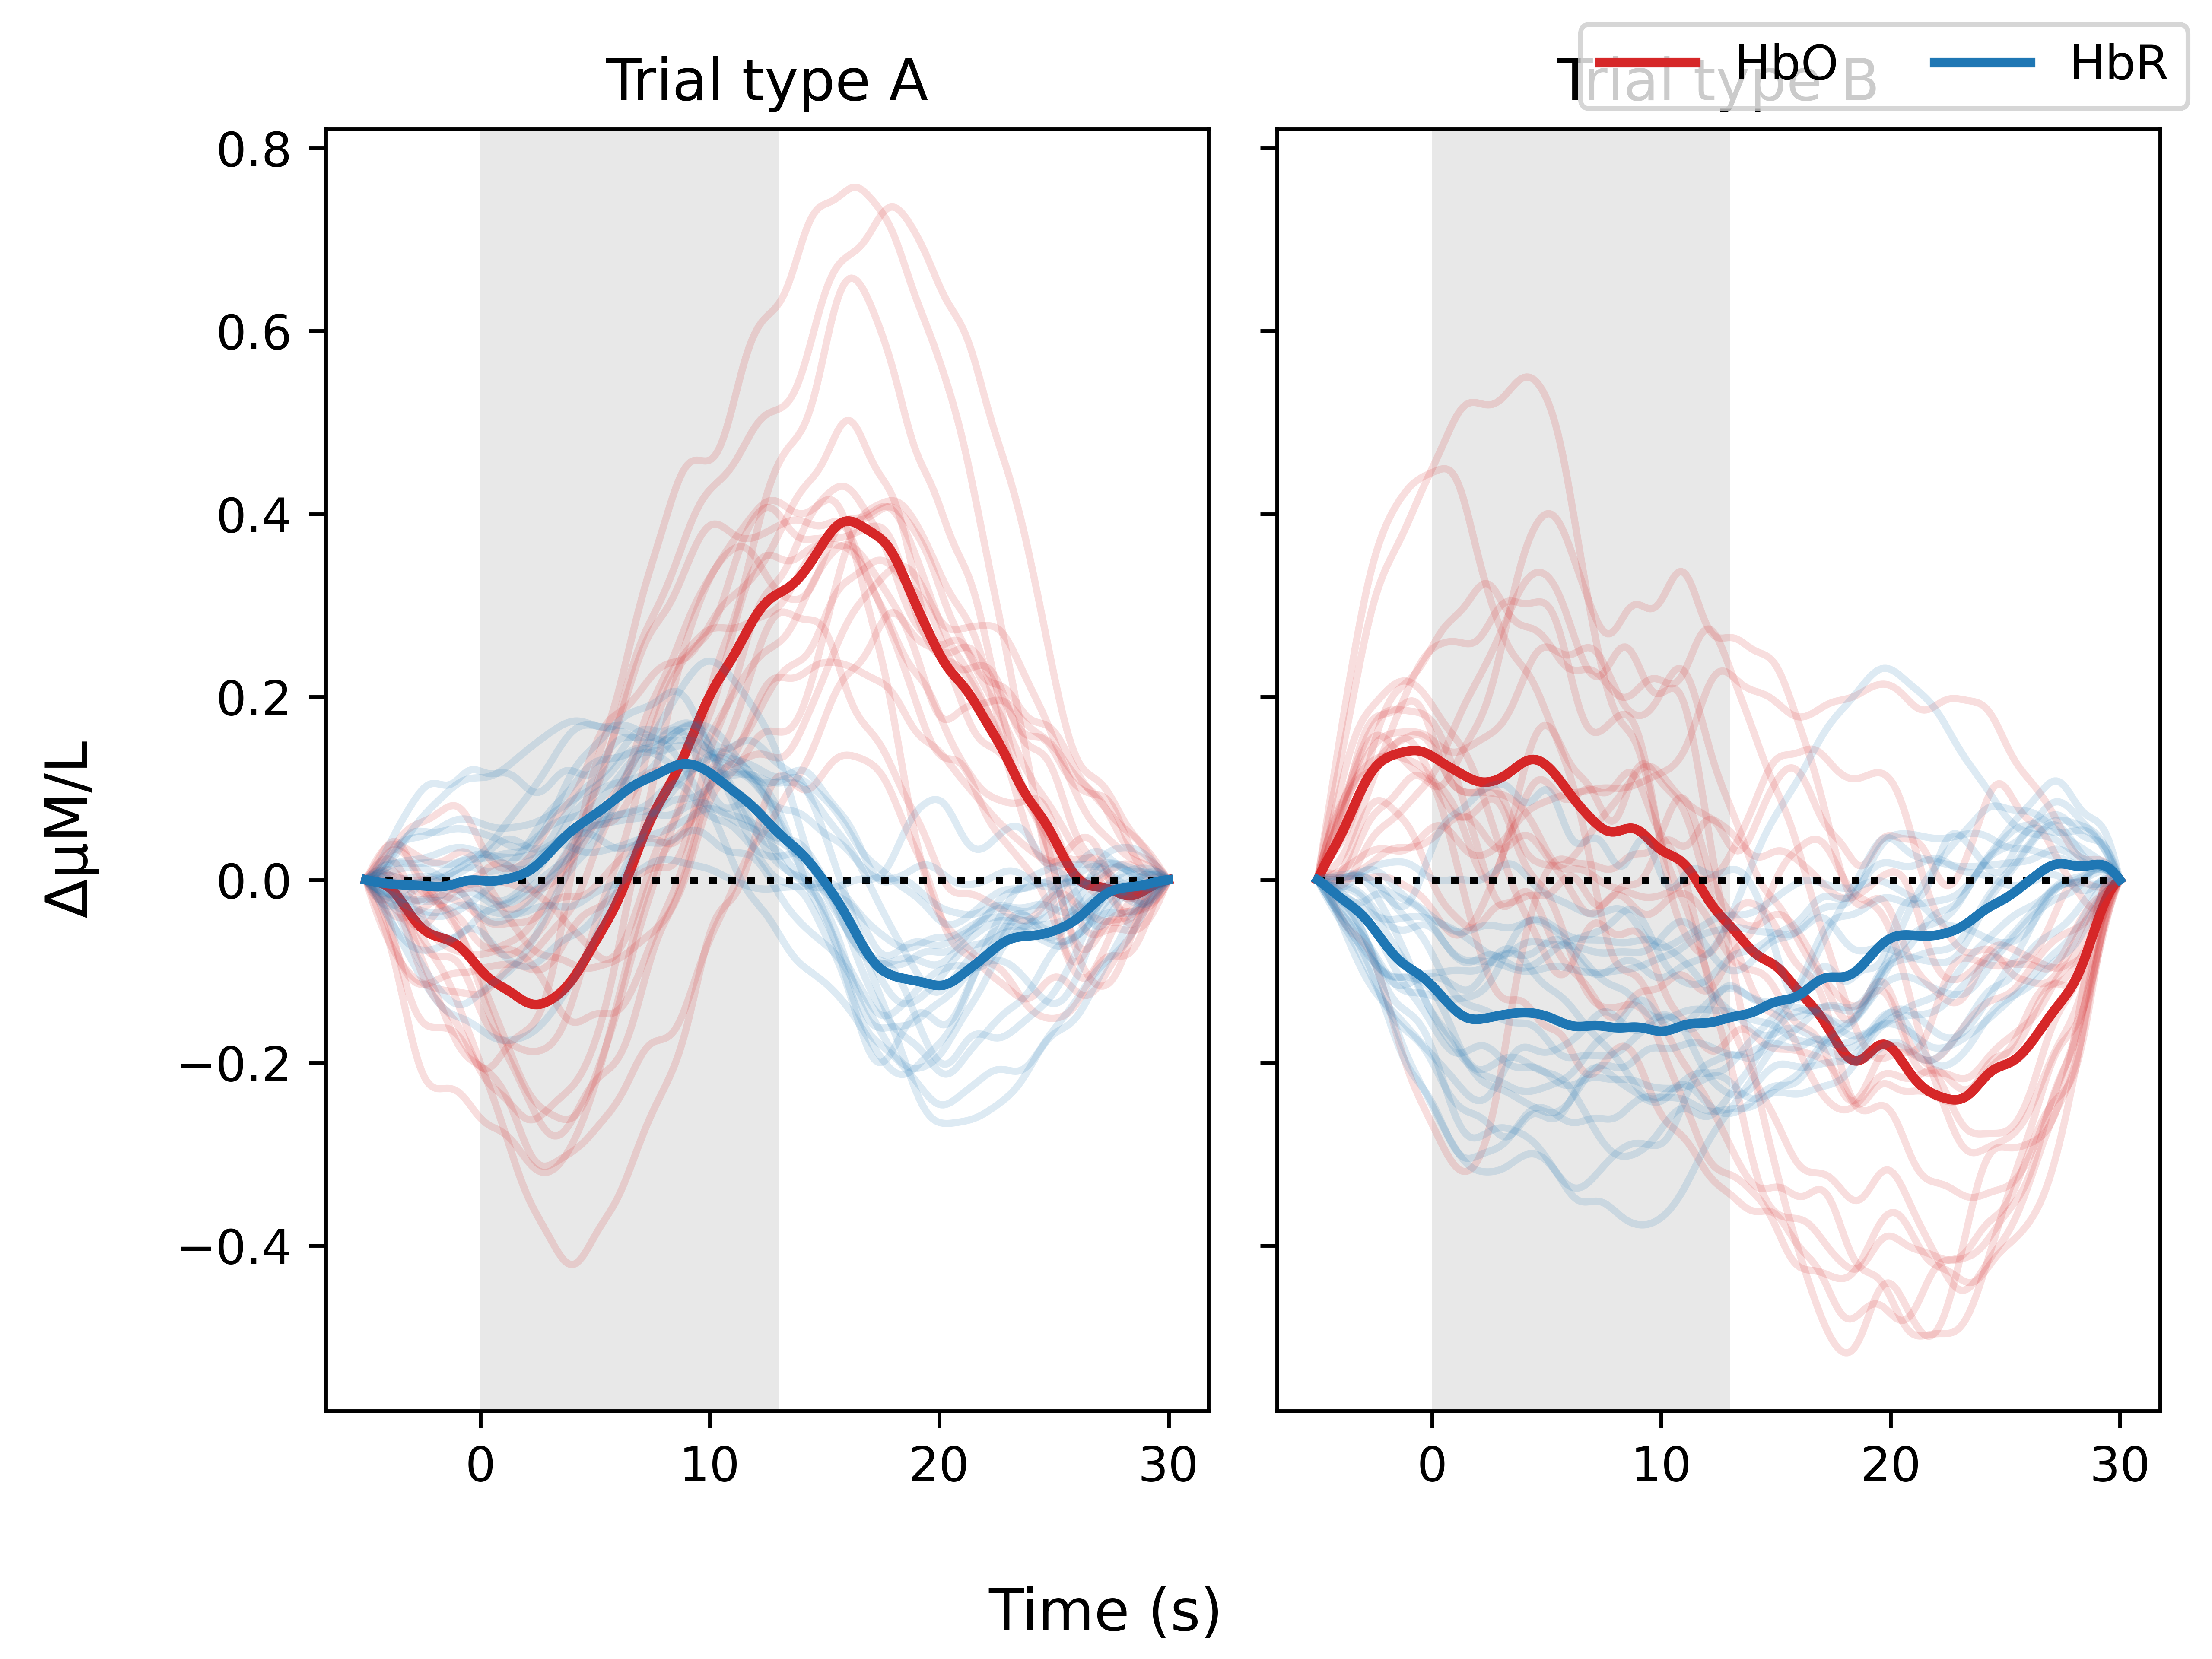
Epoching and averaging
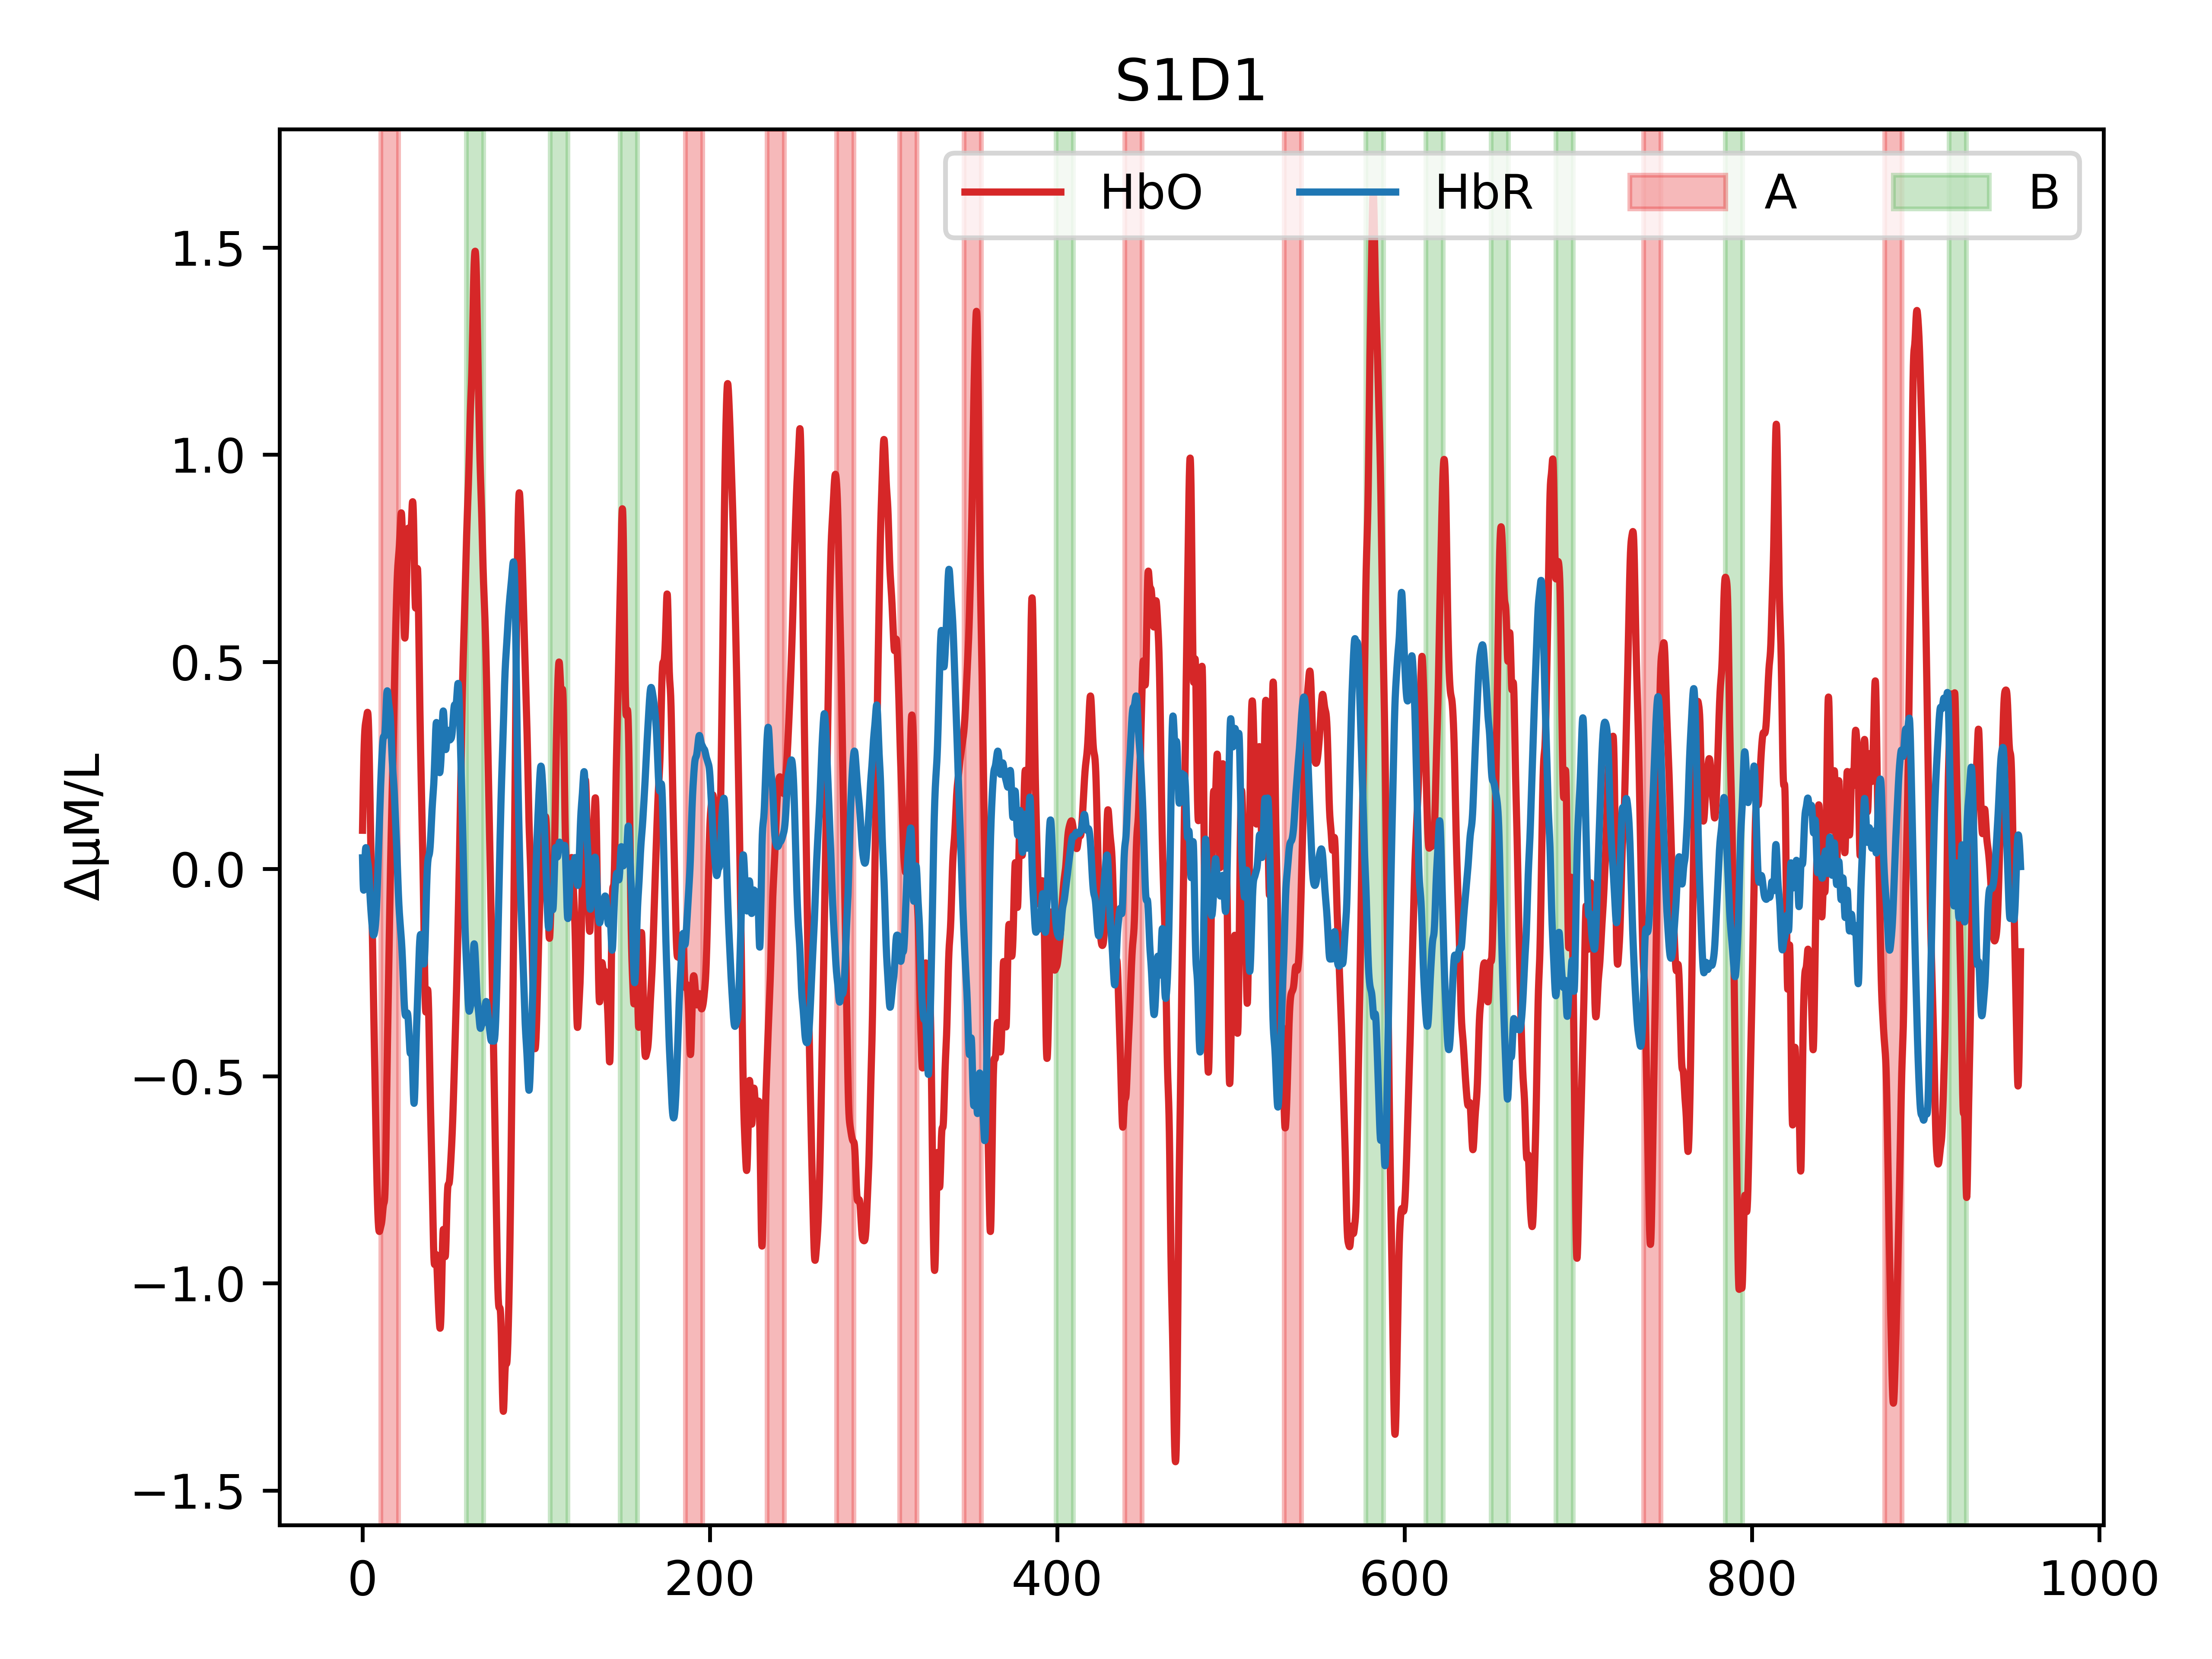
Epoching and averaging
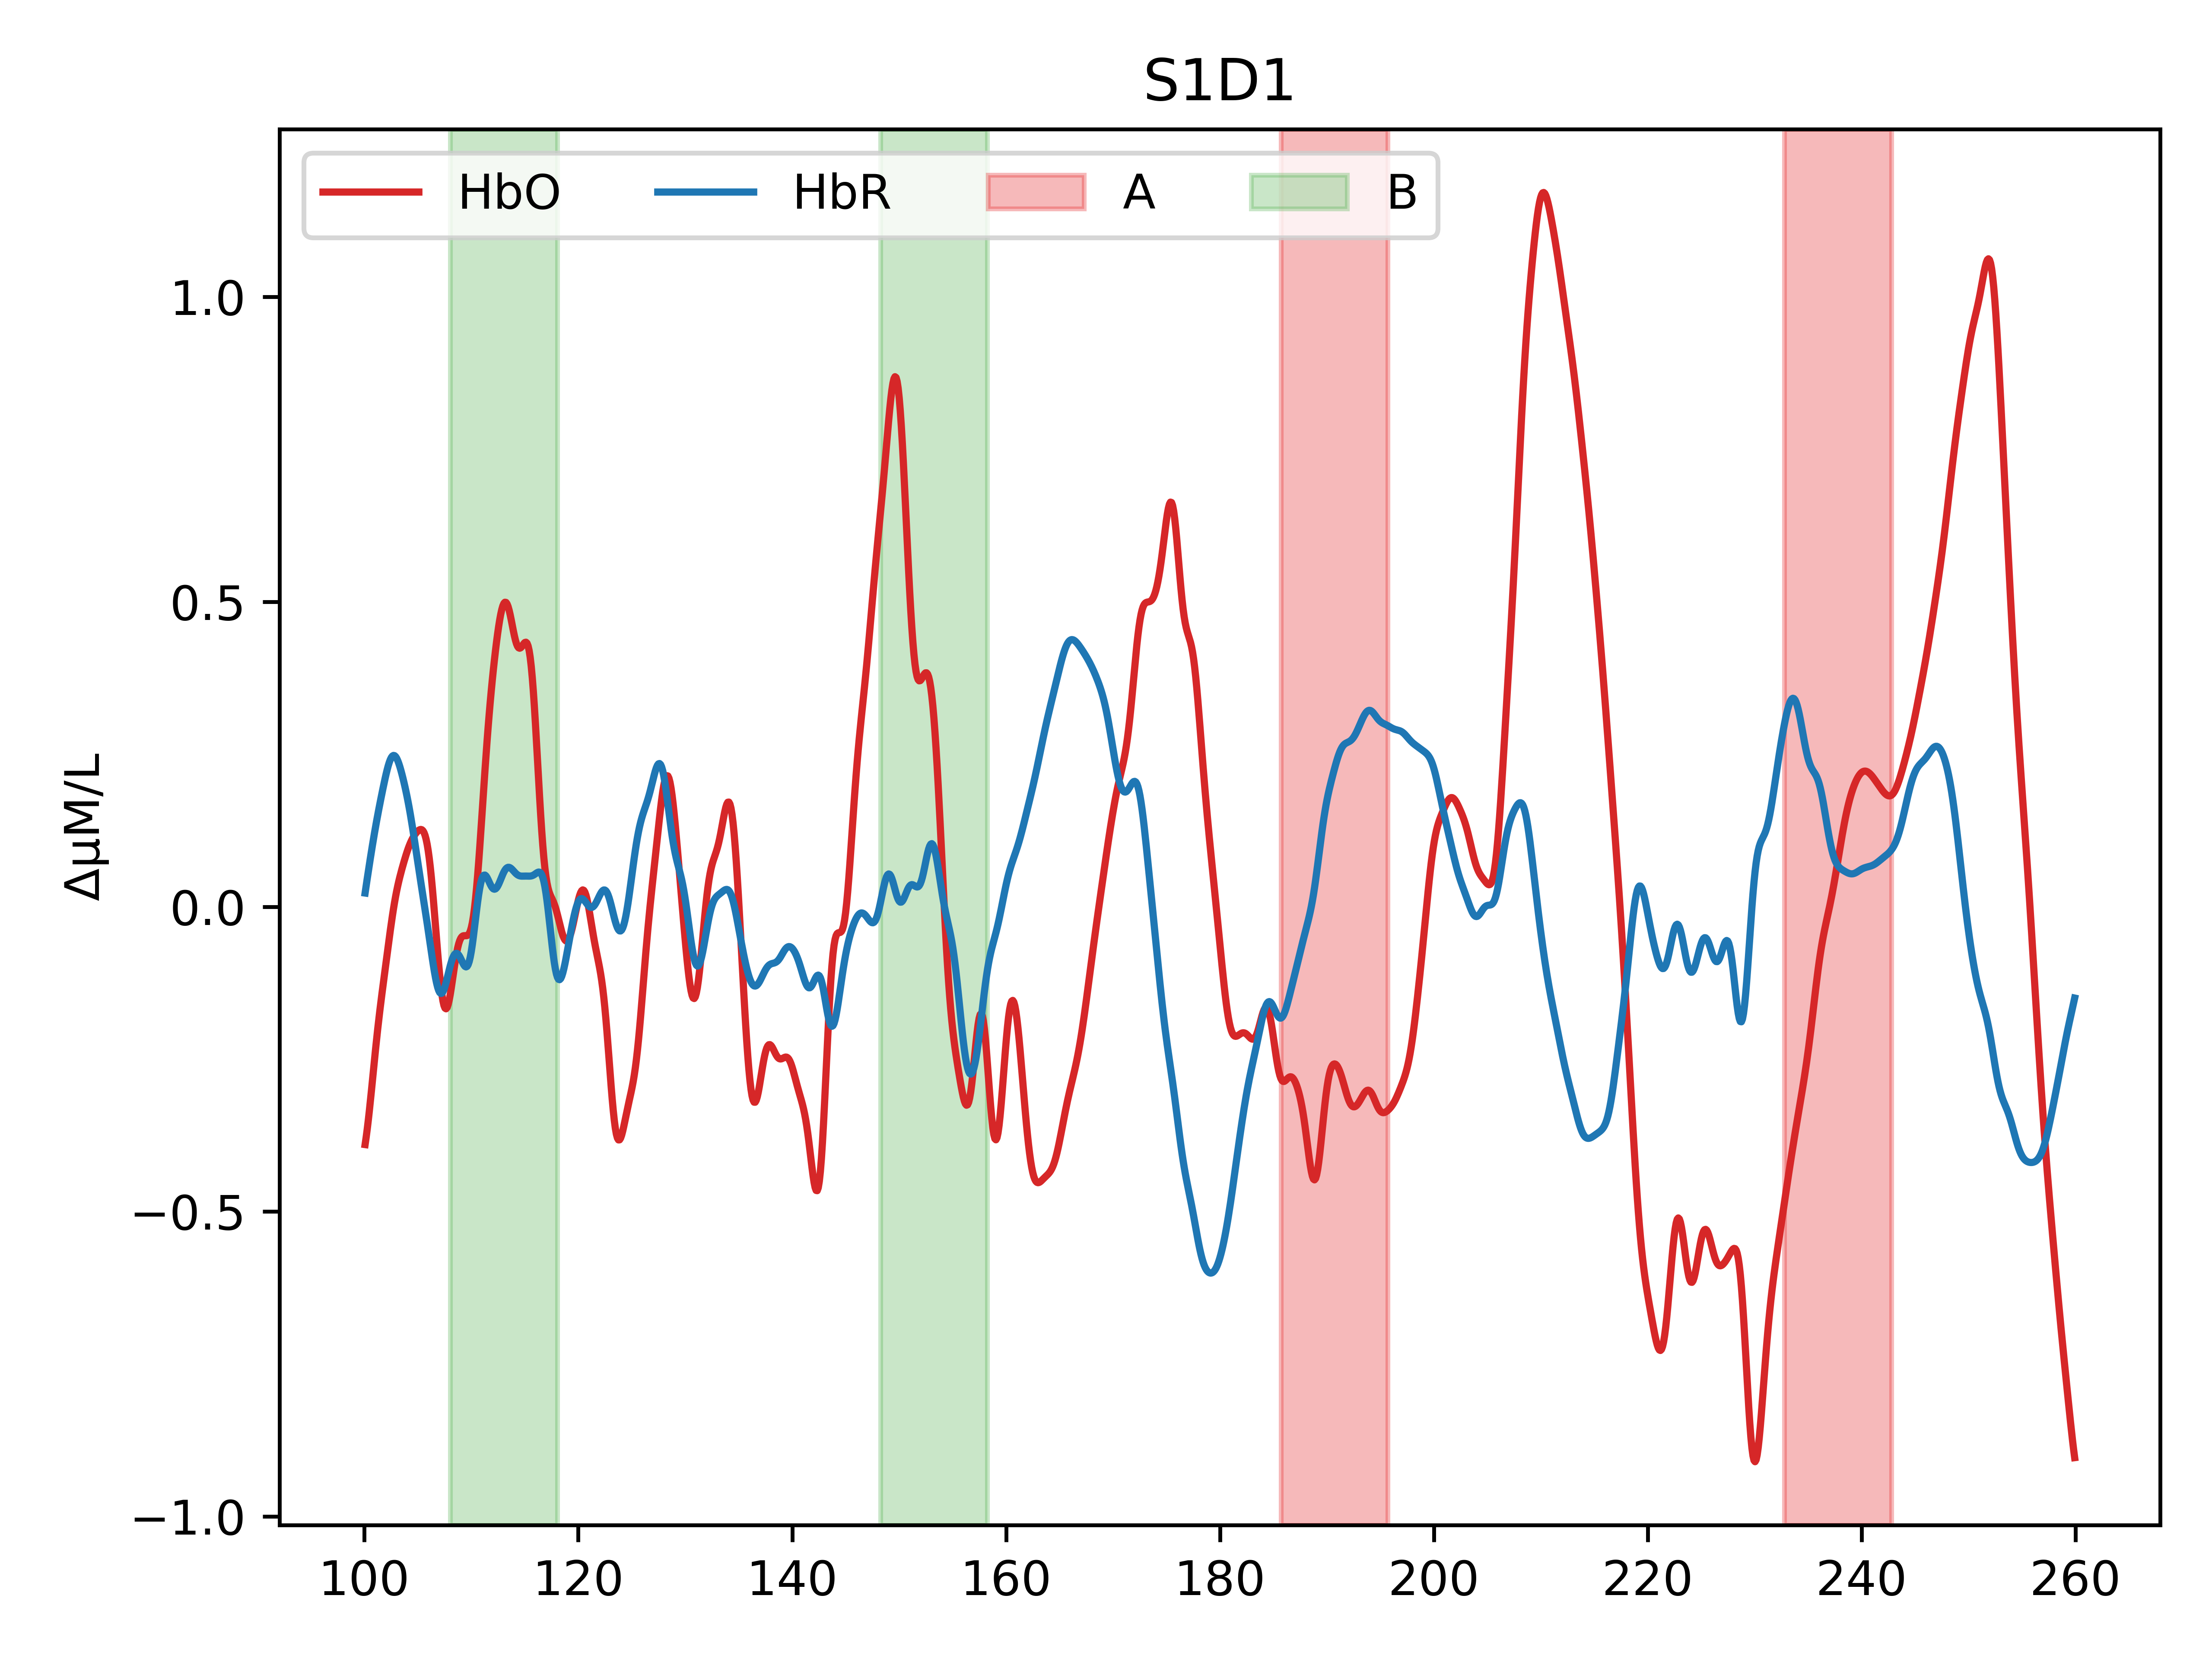
Epoching and averaging
What now?
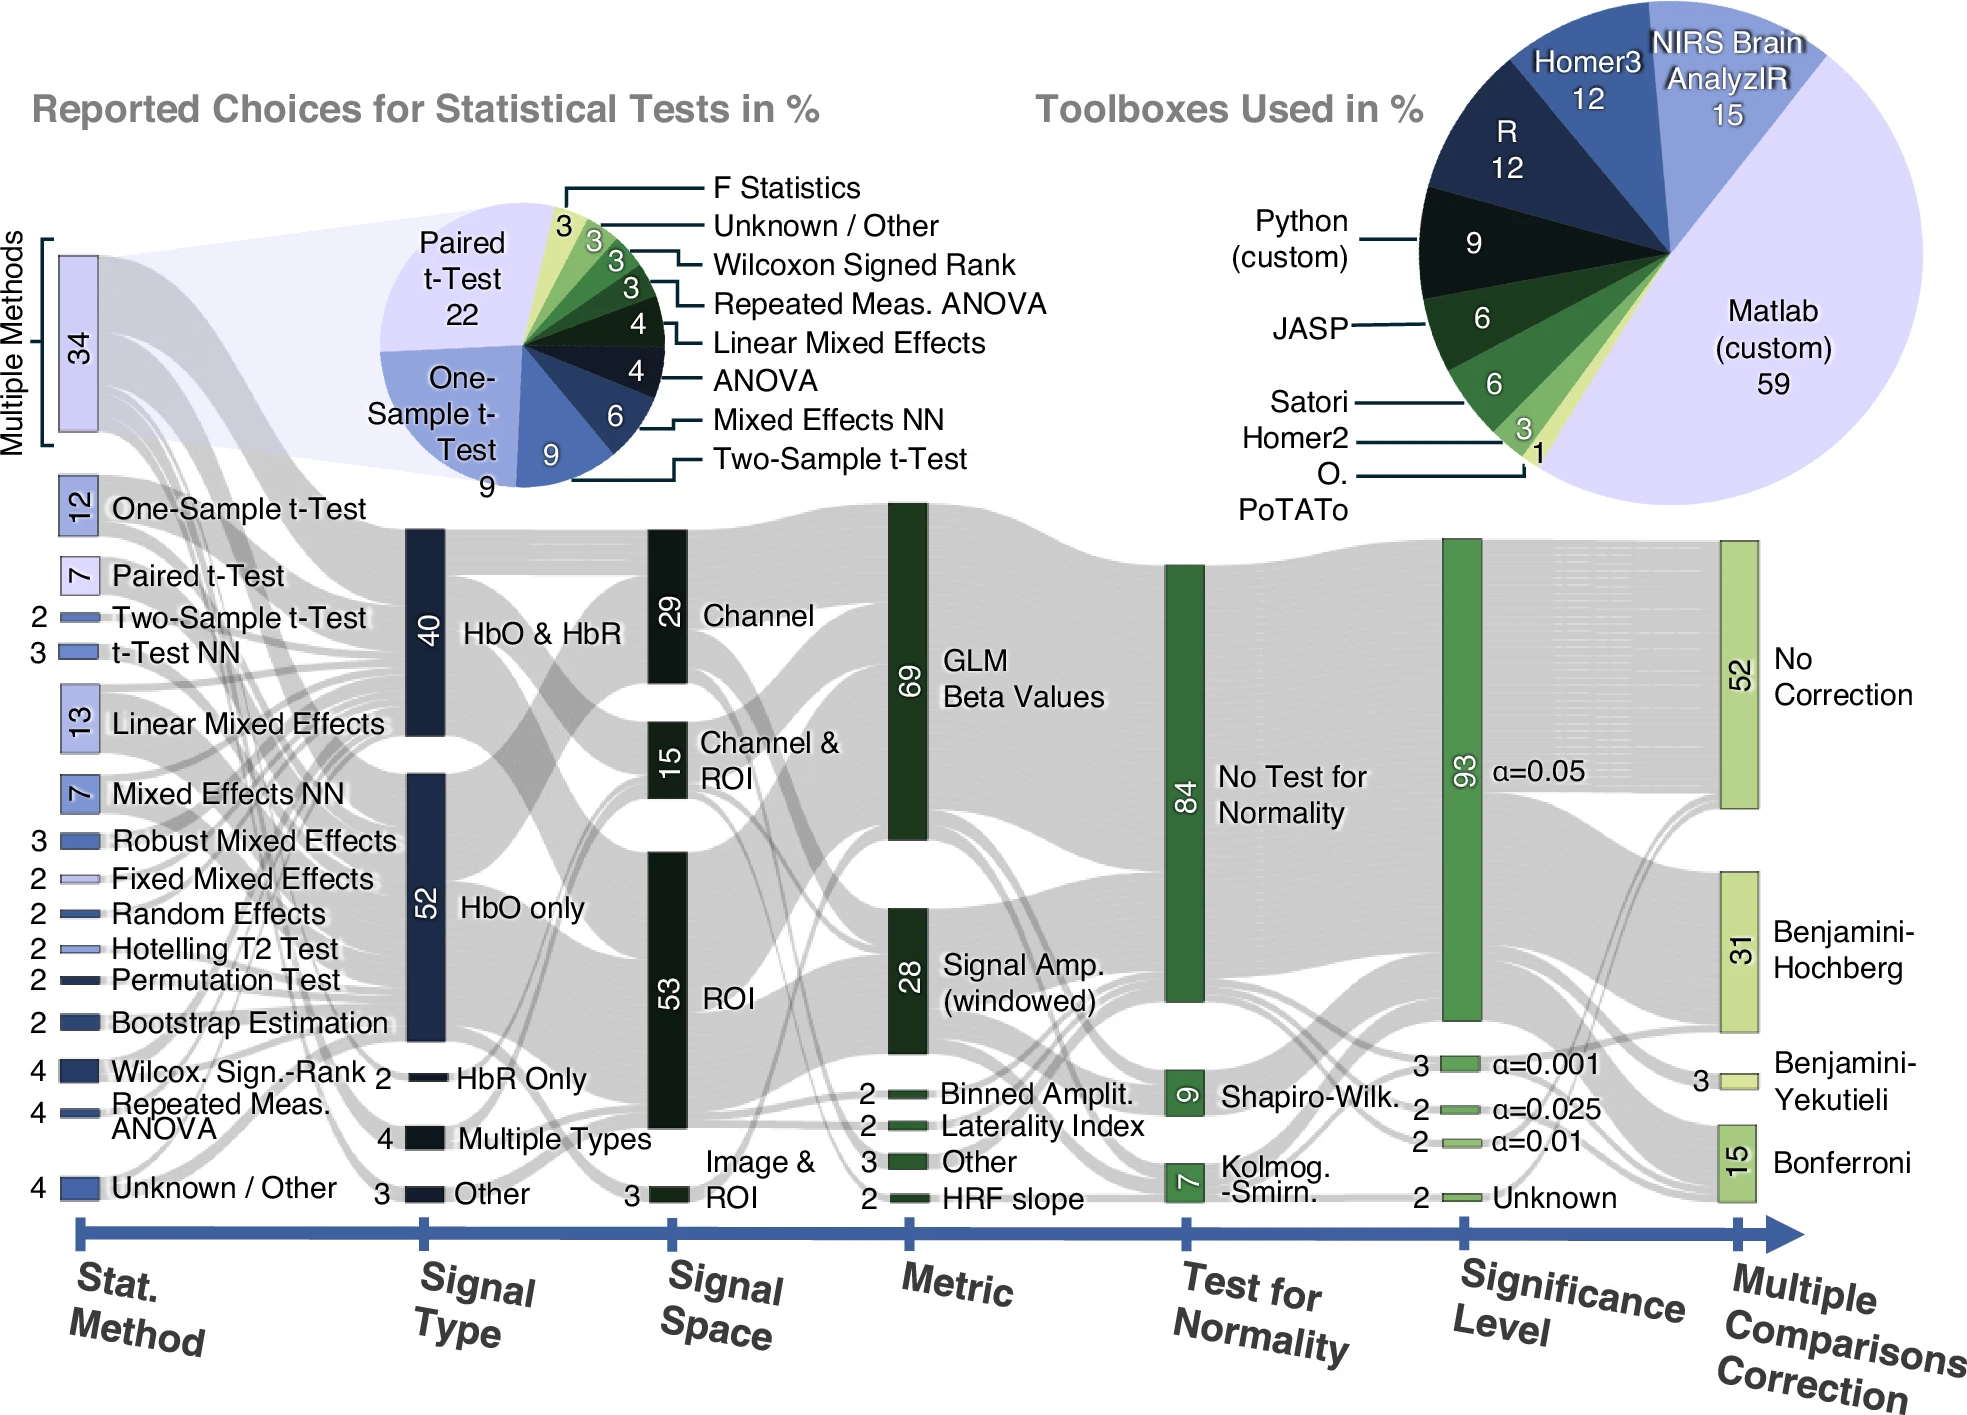
Designing a preprocessing pipeline
The FRESH initiative
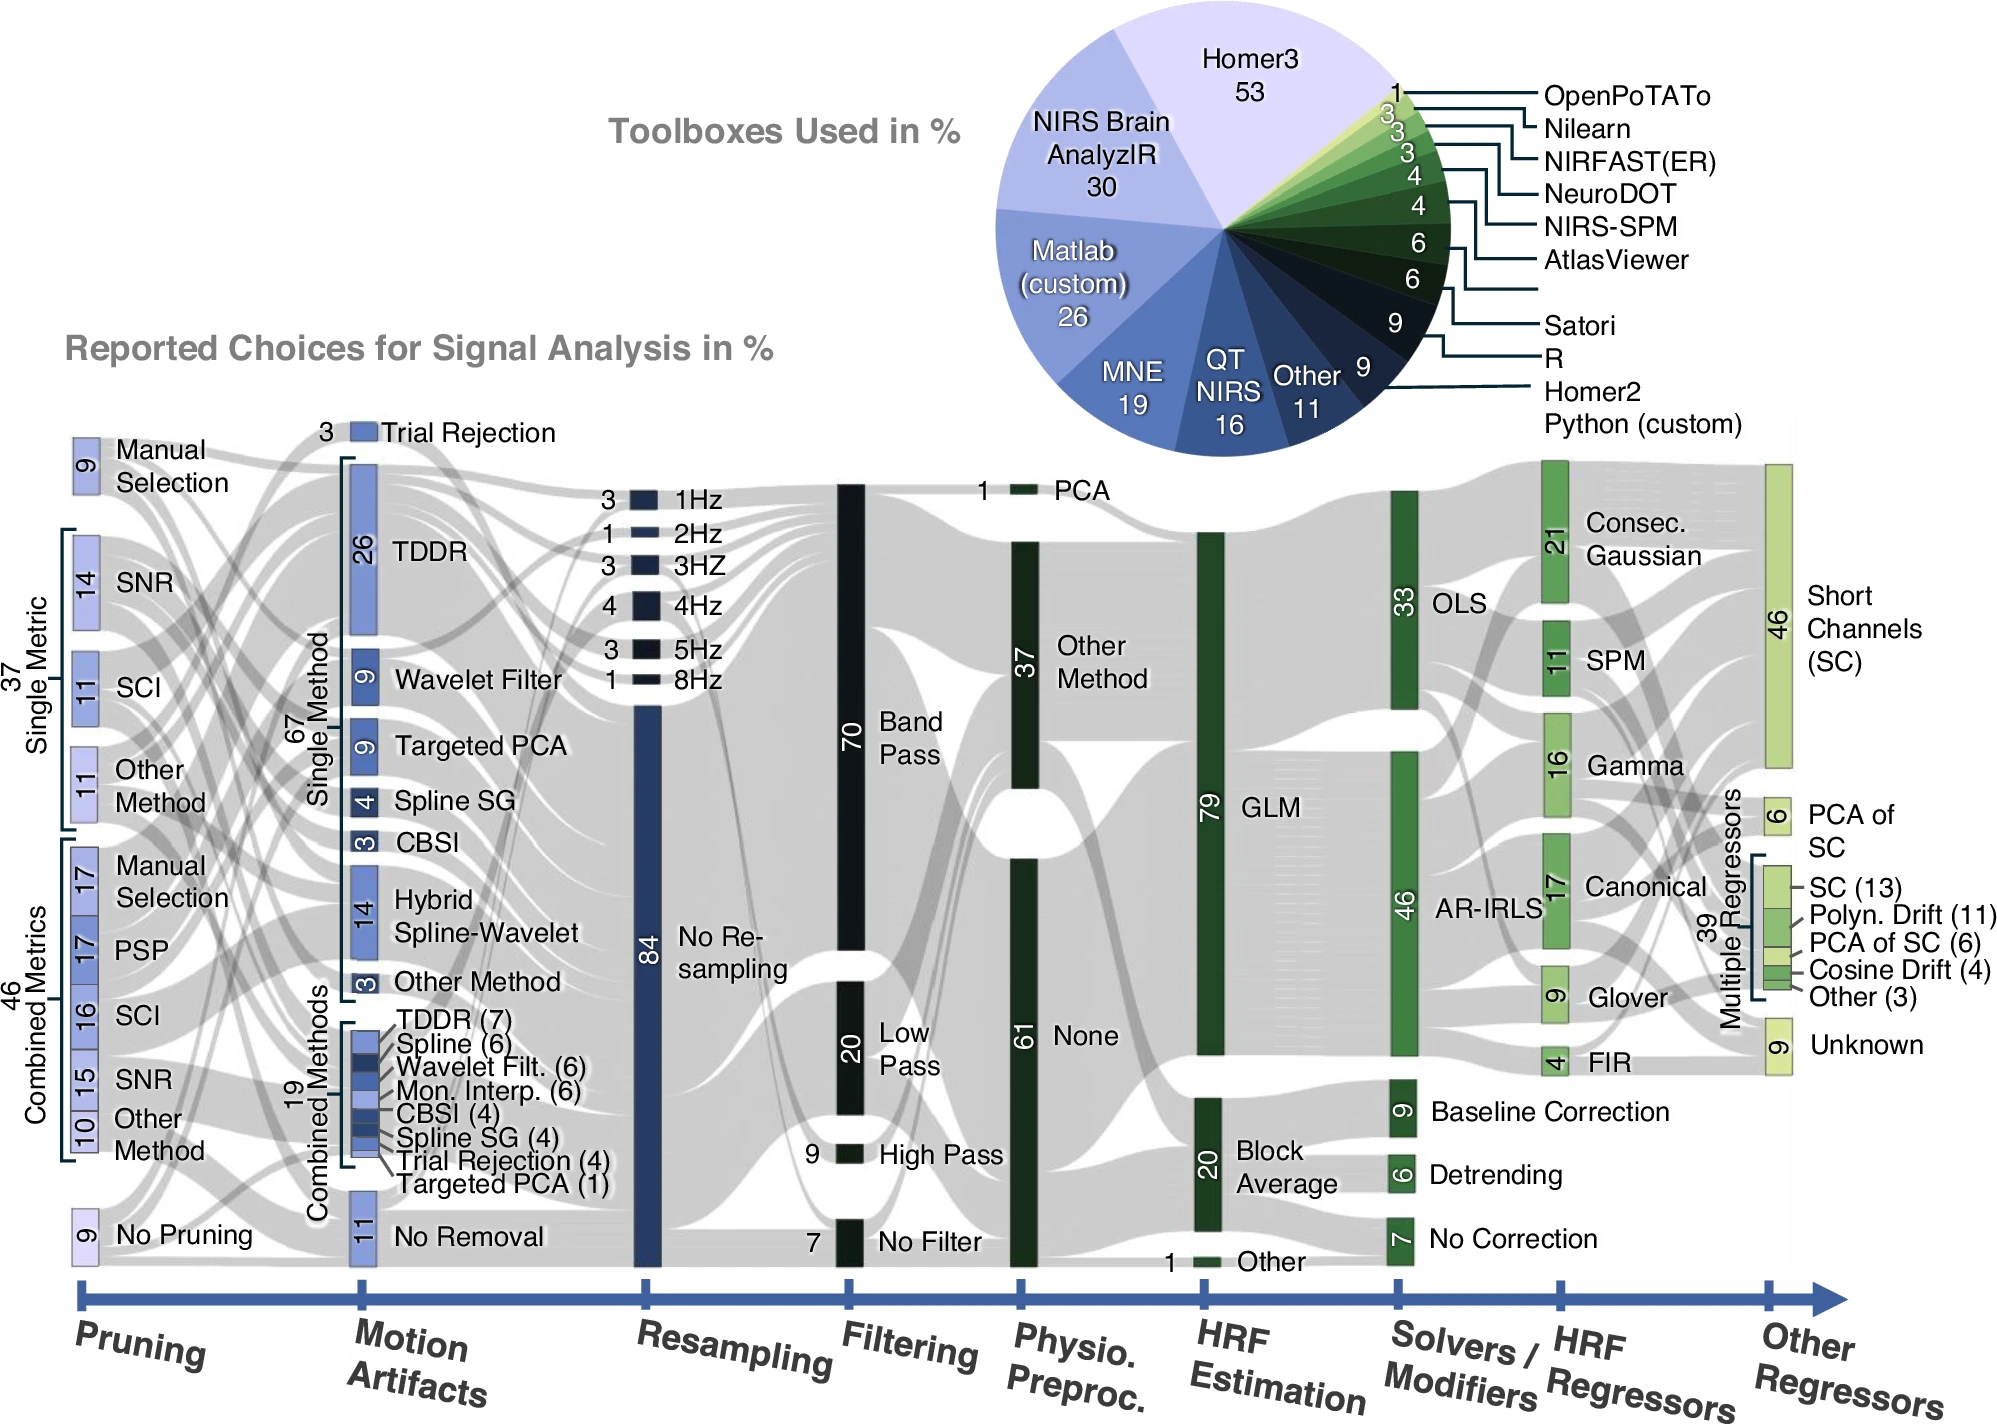
Designing a preprocessing pipeline
The FRESH initiative
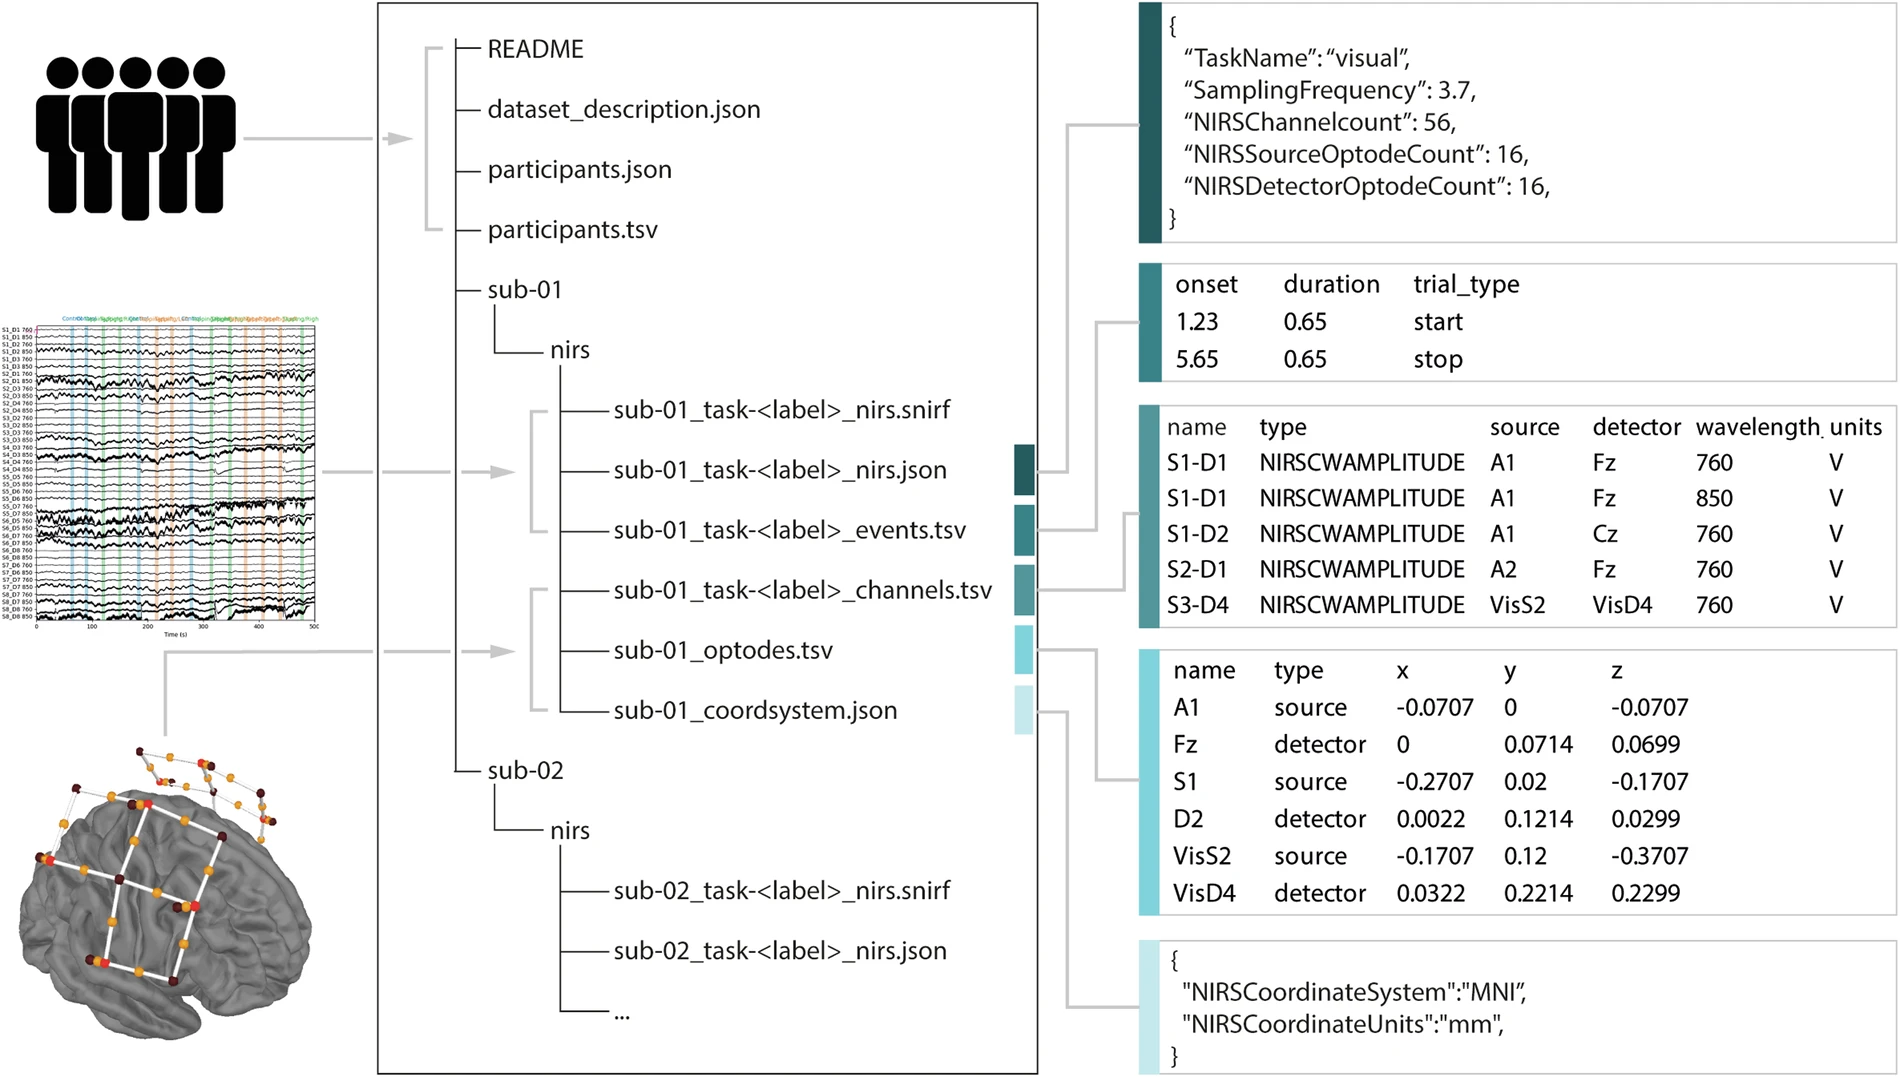
Data organisation: BIDS format
Luke, R., Oostenveld, R., Cockx, H., Niso, G., Shader, M. J., Orihuela-Espina, F., … & Pollonini, L. (2025). NIRS-BIDS: brain imaging data structure extended to near-infrared spectroscopy. Scientific Data, 12(1), 159.